
Is Universal Display Corporation's (NASDAQ:OLED) Latest Stock Performance A Reflection Of Its Financial Health?
Is Universal Display Corporation's (NASDAQ:OLED) Latest Stock Performance A Reflection Of Its Financial Health?
Universal Display's (NASDAQ:OLED) stock is up by a considerable 34% over the past three months. Given the company's impressive performance, we decided to study its financial indicators more closely as a company's financial health over the long-term usually dictates market outcomes. Specifically, we decided to study Universal Display's ROE in this article.
過去三個月,Universal Display(納斯達克:oled概念)的股票上漲了驚人的34%。鑑於該公司的出色表現,我們決定更仔細地研究其財務指標,因爲長期來看,一家公司的財務健康狀況通常決定市場結果。具體來說,我們決定在本文中研究Universal Display的roe。
Return on equity or ROE is a key measure used to assess how efficiently a company's management is utilizing the company's capital. In other words, it is a profitability ratio which measures the rate of return on the capital provided by the company's shareholders.
淨資產收益率(roe)是衡量公司經營管理層如何有效利用公司資本的關鍵指標。換言之,它是一種利潤率,衡量由公司股東提供的資本的回報率。
How Do You Calculate Return On Equity?
怎樣計算ROE?
ROE can be calculated by using the formula:
淨資產收益率可以使用以下公式進行計算:
Return on Equity = Net Profit (from continuing operations) ÷ Shareholders' Equity
淨資產收益率 = 淨利潤(從持續經營中獲得)÷ 股東權益
So, based on the above formula, the ROE for Universal Display is:
因此,根據上述公式,全球盛顯公司的 ROE 爲:
15% = US$220m ÷ US$1.5b (Based on the trailing twelve months to March 2024).
15% = US$220m ÷ US$1.5b (基於2024年3月過去的12個月)。
The 'return' is the profit over the last twelve months. Another way to think of that is that for every $1 worth of equity, the company was able to earn $0.15 in profit.
“回報”是過去十二個月的利潤,也可以這樣認爲,對於每一美元的股權,公司能夠獲得0.15美元的利潤。
What Is The Relationship Between ROE And Earnings Growth?
既然我們已經確定ROE是一種有效的利潤生成標準,用於評估公司未來的盈利能力,我們現在需要評估公司“保留”爲未來增長而重新投資的利潤多少,這使我們對公司的增長潛力有了一個了解。一般而言,在其他條件相等的情況下,ROE和利潤留存高的公司,增長率比沒有這些屬性的公司要高。
Thus far, we have learned that ROE measures how efficiently a company is generating its profits. Depending on how much of these profits the company reinvests or "retains", and how effectively it does so, we are then able to assess a company's earnings growth potential. Assuming everything else remains unchanged, the higher the ROE and profit retention, the higher the growth rate of a company compared to companies that don't necessarily bear these characteristics.
因此,我們已經了解到ROE衡量公司如何高效地創造利潤。根據公司重新投資或“保留”的利潤數量以及其有效性,我們隨後能夠評估公司的收益增長潛力。假設其他所有因素均保持不變,則ROE和利潤保留率越高,相對於不一定具備這些特徵的公司,公司的增長率就越高。
Universal Display's Earnings Growth And 15% ROE
Universal Display的收益增長和15%的roe
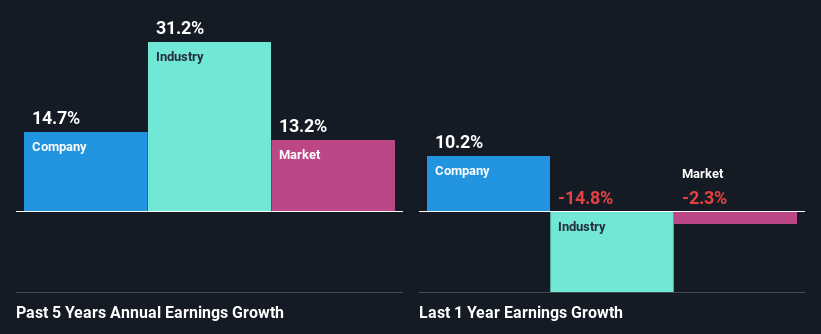
At first glance, Universal Display seems to have a decent ROE. Further, the company's ROE is similar to the industry average of 15%. This certainly adds some context to Universal Display's moderate 15% net income growth seen over the past five years.
乍一看,Universal Display的roe似乎不錯。此外,該公司的roe與行業平均水平相似,均爲15%。這無疑爲Universal Display過去五年中適度的15%淨收入增長增添了一些上下文。
We then compared Universal Display's net income growth with the industry and found that the company's growth figure is lower than the average industry growth rate of 31% in the same 5-year period, which is a bit concerning.
然後我們將Universal Display的淨收入增長與行業進行比較,並發現該公司的增長數字低於在同一5年期間的行業平均增長率31%,這有點令人擔憂。
Earnings growth is an important metric to consider when valuing a stock. What investors need to determine next is if the expected earnings growth, or the lack of it, is already built into the share price. By doing so, they will have an idea if the stock is headed into clear blue waters or if swampy waters await. Is Universal Display fairly valued compared to other companies? These 3 valuation measures might help you decide.
收益增長是考慮估值股票時需要考慮的重要指標。投資者需要判斷的是,預期的收益增長率,或者缺乏收益增長率,是否已經反映在股票價格中。通過這樣做,他們將對股票是否進入清晰的藍色水域,還是要面對沼澤水域有了一個想法。與其他公司相比,Universal Display的估值是否合理?這三項估值指標可能會幫助您決定。
Is Universal Display Efficiently Re-investing Its Profits?
Universal Display是否高效地再投資收益?
Universal Display has a healthy combination of a moderate three-year median payout ratio of 27% (or a retention ratio of 73%) and a respectable amount of growth in earnings as we saw above, meaning that the company has been making efficient use of its profits.
正如我們上面所看到的,Universal Display具有中等的三年中位數支付比率爲27%(或保留比率爲73%)和可觀的盈利增長,這意味着該公司一直在有效地利用其利潤。此外,Universal Display在七年的時間內支付了分紅,這意味着公司非常重視與股東分享其利潤。根據最新的分析師預測,我們發現該公司未來三年的支付比率預計將保持穩定在27%。
Additionally, Universal Display has paid dividends over a period of seven years which means that the company is pretty serious about sharing its profits with shareholders. Based on the latest analysts' estimates, we found that the company's future payout ratio over the next three years is expected to hold steady at 27%.
總體而言,我們對Universal Display的表現感到相當滿意。特別是,我們喜歡該公司正在大量再投資其業務,並以高回報率進行。因此,其盈利增長的相當程度並不令人驚訝。我們還研究了最新的分析師預測,並發現該公司的盈利增長預計將類似於其當前的增長率。要了解更多關於公司的最新分析師預測,請查看此分析師預測可視化。
Summary
總的來說,我們對偉明環保的表現非常滿意。具體而言,我們喜歡公司以高回報率再投資了其利潤的很大一部分。當然,這導致公司的收益大幅增長。但是,最新的行業分析師預測表明,該公司的收益預計將加速增長。
Overall, we are quite pleased with Universal Display's performance. Particularly, we like that the company is reinvesting heavily into its business, and at a high rate of return. As a result, the decent growth in its earnings is not surprising. We also studied the latest analyst forecasts and found that the company's earnings growth is expected be similar to its current growth rate. To know more about the latest analysts predictions for the company, check out this visualization of analyst forecasts for the company.
總的來說,我們對universal display的表現感到相當滿意。特別是,我們喜歡這家公司以高回報率大量重新投資業務。因此,其盈利的不錯增長並不令人意外。我們還研究了最新的分析師預測,並發現該公司的盈利增長預計將與其當前的增長速度相似。想進一步了解公司最新的分析師預測,請查看這個可視化分析師預測的頁面。
Have feedback on this article? Concerned about the content? Get in touch with us directly. Alternatively, email editorial-team (at) simplywallst.com.
This article by Simply Wall St is general in nature. We provide commentary based on historical data and analyst forecasts only using an unbiased methodology and our articles are not intended to be financial advice. It does not constitute a recommendation to buy or sell any stock, and does not take account of your objectives, or your financial situation. We aim to bring you long-term focused analysis driven by fundamental data. Note that our analysis may not factor in the latest price-sensitive company announcements or qualitative material. Simply Wall St has no position in any stocks mentioned.
對本文有反饋?關於內容有所顧慮?直接和我們聯繫。或者,發送電子郵件至editorial-team (at) simplywallst.com。
這篇文章是Simply Wall St的一般性文章。我們根據歷史數據和分析師預測提供評論,只使用公正的方法論,我們的文章並不意味着提供任何金融建議。文章不構成買賣任何股票的建議,也不考慮您的目標或您的財務狀況。我們的目標是帶給您基本數據驅動的長期關注分析。請注意,我們的分析可能不考慮最新的價格敏感公司公告或定性材料。Simply Wall St沒有任何股票頭寸。
Have feedback on this article? Concerned about the content? Get in touch with us directly. Alternatively, email editorial-team@simplywallst.com
對本文有反饋?關於內容有所顧慮?直接和我們聯繫。或者發送電子郵件至editorial-team@simplywallst.com。
譯文內容由第三人軟體翻譯。