
Dycom Industries (NYSE:DY) Jumps 4.0% This Week, Though Earnings Growth Is Still Tracking Behind Five-year Shareholder Returns
Dycom Industries (NYSE:DY) Jumps 4.0% This Week, Though Earnings Growth Is Still Tracking Behind Five-year Shareholder Returns
When you buy a stock there is always a possibility that it could drop 100%. But on a lighter note, a good company can see its share price rise well over 100%. For instance, the price of Dycom Industries, Inc. (NYSE:DY) stock is up an impressive 208% over the last five years. It's also good to see the share price up 24% over the last quarter.
當你買入股票時,它總是有可能下跌100%。但簡而言之,一家好的公司的股價可以上漲超過100%。例如,戴康工業公司(紐約證券交易所代碼:DY)的股票價格在過去五年中上漲了令人印象深刻的208%。股價在上個季度上漲了24%也令人高興。
Since it's been a strong week for Dycom Industries shareholders, let's have a look at trend of the longer term fundamentals.
由於對Dycom Industries的股東來說,這是強勁的一週,讓我們來看看長期基本面的趨勢。
While the efficient markets hypothesis continues to be taught by some, it has been proven that markets are over-reactive dynamic systems, and investors are not always rational. One imperfect but simple way to consider how the market perception of a company has shifted is to compare the change in the earnings per share (EPS) with the share price movement.
儘管一些人繼續教導高效市場假說,但事實證明,市場是反應過度的動態系統,投資者並不總是理性的。考慮市場對公司的看法發生了怎樣的變化的一種不完美但簡單的方法是將每股收益(EPS)的變化與股價走勢進行比較。
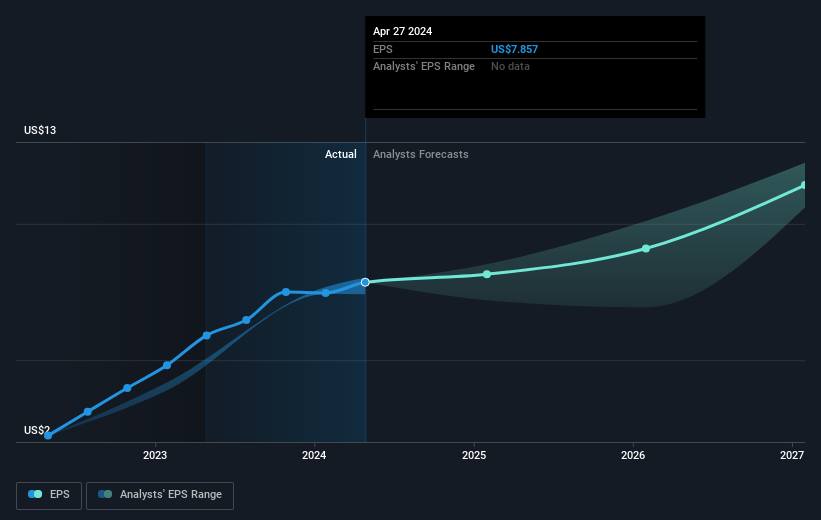
During five years of share price growth, Dycom Industries achieved compound earnings per share (EPS) growth of 33% per year. The EPS growth is more impressive than the yearly share price gain of 25% over the same period. So one could conclude that the broader market has become more cautious towards the stock.
在五年的股價增長中,戴康工業實現了每年33%的複合每股收益(EPS)增長。每股收益的增長比同期25%的年度股價增長更令人印象深刻。因此,人們可以得出結論,整個市場對該股變得更加謹慎。
You can see below how EPS has changed over time (discover the exact values by clicking on the image).
你可以在下面看到 EPS 是如何隨着時間的推移而變化的(點擊圖片發現確切的值)。
We know that Dycom Industries has improved its bottom line over the last three years, but what does the future have in store? You can see how its balance sheet has strengthened (or weakened) over time in this free interactive graphic.
我們知道Dycom Industries在過去三年中提高了利潤,但是未來會怎樣?您可以在這張免費的交互式圖片中看到其資產負債表如何隨着時間的推移而增強(或減弱)。
A Different Perspective
不同的視角
It's good to see that Dycom Industries has rewarded shareholders with a total shareholder return of 54% in the last twelve months. That's better than the annualised return of 25% over half a decade, implying that the company is doing better recently. Someone with an optimistic perspective could view the recent improvement in TSR as indicating that the business itself is getting better with time. I find it very interesting to look at share price over the long term as a proxy for business performance. But to truly gain insight, we need to consider other information, too. For example, we've discovered 1 warning sign for Dycom Industries that you should be aware of before investing here.
很高興看到戴康工業在過去十二個月中向股東提供了54%的總股東回報率。這比五年來25%的年化回報率要好,這意味着該公司最近的表現更好。持樂觀態度的人可能會將最近股東總回報率的改善視爲業務本身隨着時間的推移而變得更好。我發現將長期股價視爲業務績效的代表非常有趣。但是,要真正獲得見解,我們還需要考慮其他信息。例如,我們發現了Dycom Industries的一個警告信號,在這裏投資之前,你應該注意這個信號。
For those who like to find winning investments this free list of undervalued companies with recent insider purchasing, could be just the ticket.
對於那些喜歡尋找獲利投資的人來說,這份最近進行內幕收購的被低估公司的免費清單可能只是入場券。
Please note, the market returns quoted in this article reflect the market weighted average returns of stocks that currently trade on American exchanges.
請注意,本文引用的市場回報反映了目前在美國交易所交易的股票的市場加權平均回報。
Have feedback on this article? Concerned about the content? Get in touch with us directly. Alternatively, email editorial-team (at) simplywallst.com.
This article by Simply Wall St is general in nature. We provide commentary based on historical data and analyst forecasts only using an unbiased methodology and our articles are not intended to be financial advice. It does not constitute a recommendation to buy or sell any stock, and does not take account of your objectives, or your financial situation. We aim to bring you long-term focused analysis driven by fundamental data. Note that our analysis may not factor in the latest price-sensitive company announcements or qualitative material. Simply Wall St has no position in any stocks mentioned.
對這篇文章有反饋嗎?對內容感到擔憂?直接聯繫我們。 或者,給編輯團隊 (at) simplywallst.com 發送電子郵件。
Simply Wall St的這篇文章本質上是籠統的。我們僅使用公正的方法根據歷史數據和分析師的預測提供評論,我們的文章無意作爲財務建議。它不構成買入或賣出任何股票的建議,也沒有考慮到您的目標或財務狀況。我們的目標是爲您提供由基本數據驅動的長期重點分析。請注意,我們的分析可能不考慮最新的價格敏感型公司公告或定性材料。簡而言之,華爾街沒有持有任何上述股票的頭寸。
Have feedback on this article? Concerned about the content? Get in touch with us directly. Alternatively, email editorial-team@simplywallst.com
對這篇文章有反饋嗎?對內容感到擔憂?直接聯繫我們。 或者,發送電子郵件至 editorial-team@simplywallst.com
譯文內容由第三人軟體翻譯。