
The Three-year Loss for Veritex Holdings (NASDAQ:VBTX) Shareholders Likely Driven by Its Shrinking Earnings
The Three-year Loss for Veritex Holdings (NASDAQ:VBTX) Shareholders Likely Driven by Its Shrinking Earnings
For many investors, the main point of stock picking is to generate higher returns than the overall market. But the risk of stock picking is that you will likely buy under-performing companies. We regret to report that long term Veritex Holdings, Inc. (NASDAQ:VBTX) shareholders have had that experience, with the share price dropping 38% in three years, versus a market return of about 20%.
對於很多投資者來說,選擇股票的主要目的是產生比整體市場更高的回報。但是選股的風險在於您可能會購買表現不佳的公司。不幸的是,納斯達克veritex控股有限公司(NASDAQ:VBTX)的長期股東已經經歷了這種經歷,股票價格在三年內下跌了38%,而市場回報約爲20%。
While the last three years has been tough for Veritex Holdings shareholders, this past week has shown signs of promise. So let's look at the longer term fundamentals and see if they've been the driver of the negative returns.
雖然過去三年對於Veritex控股的股東來說是艱難的,但是過去的那一週顯示出了希望的跡象。因此,讓我們看看更長期的基本面,並確定它們是否是負回報的驅動因素。
While the efficient markets hypothesis continues to be taught by some, it has been proven that markets are over-reactive dynamic systems, and investors are not always rational. One flawed but reasonable way to assess how sentiment around a company has changed is to compare the earnings per share (EPS) with the share price.
雖然一些人仍然在教授高效市場假說,但已經證明市場是過度反應的動態系統,投資者不總是理性的。一種有缺陷但合理的評估公司情緒變化的方法是比較每股收益 (EPS) 與股價。
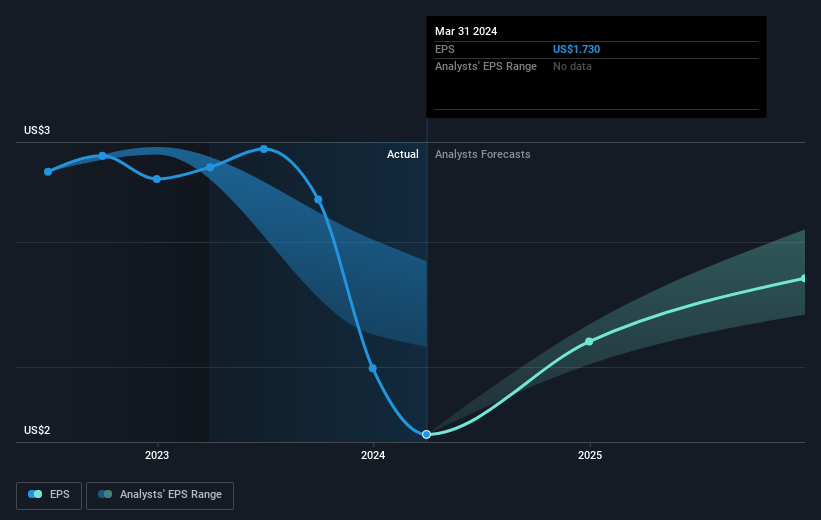
During the three years that the share price fell, Veritex Holdings' earnings per share (EPS) dropped by 5.6% each year. This reduction in EPS is slower than the 15% annual reduction in the share price. So it's likely that the EPS decline has disappointed the market, leaving investors hesitant to buy.
在股價下跌的三年中,Veritex控股的每股收益(EPS)每年下降了5.6%。EPS的下降速度比股價下降的15%慢。因此,EPS的下降很可能令市場失望,使投資者猶豫不決。納斯達克VBTX每股收益增長2024年7月3日
The image below shows how EPS has tracked over time (if you click on the image you can see greater detail).
下圖顯示了EPS隨時間的變化情況(如果您單擊該圖像,則可以查看更多詳細信息)。
Dive deeper into Veritex Holdings' key metrics by checking this interactive graph of Veritex Holdings's earnings, revenue and cash flow.
通過查看Veritex Holdings的收益,營業收入和現金流的交互式圖形來深入了解其關鍵指標。
What About Dividends?
那麼分紅怎麼樣呢?
It is important to consider the total shareholder return, as well as the share price return, for any given stock. Whereas the share price return only reflects the change in the share price, the TSR includes the value of dividends (assuming they were reinvested) and the benefit of any discounted capital raising or spin-off. So for companies that pay a generous dividend, the TSR is often a lot higher than the share price return. As it happens, Veritex Holdings' TSR for the last 3 years was -32%, which exceeds the share price return mentioned earlier. This is largely a result of its dividend payments!
考慮到任何特定股票的股東總回報以及股價回報都很重要。相對於股價回報只反映了股價的變化而言,股東總回報(TSR)包括股息的價值(假設它們被再投資)以及任何折價的資本籌集或剝離的利益。所以對於支付慷慨股息的公司來說,TSR往往比股價回報高得多。恰好,Veritex控股過去3年的TSR爲-32%,超過了前面提到的股價回報。這主要是其股息支付所致!
A Different Perspective
不同的觀點
Veritex Holdings shareholders are up 19% for the year (even including dividends). But that return falls short of the market. On the bright side, that's still a gain, and it is certainly better than the yearly loss of about 1.0% endured over half a decade. It could well be that the business is stabilizing. I find it very interesting to look at share price over the long term as a proxy for business performance. But to truly gain insight, we need to consider other information, too. Take risks, for example - Veritex Holdings has 2 warning signs we think you should be aware of.
Veritex控股的股東收益(包括股息)今年上漲了19%。但這種回報不及市場水平,但仍然是收益,並且肯定比五年來的年度虧損1.0%好得多。業務穩定下來。我覺得將股價長期看作業績的一種替代方式非常有趣。但是爲了真正獲得洞察力,我們需要考慮其他信息。例如,股票價格風險 - Veritex控股有 2個警示信號,我們認爲您應該知道。
If you like to buy stocks alongside management, then you might just love this free list of companies. (Hint: many of them are unnoticed AND have attractive valuation).
如果您喜歡與管理層一起購買股票,那麼您可能會喜歡這個公司的免費列表。 (提示:其中許多公司不爲人注意且具有吸引力的估值。)
Please note, the market returns quoted in this article reflect the market weighted average returns of stocks that currently trade on American exchanges.
請注意,本文所引述的市場回報反映了目前在美國交易所上市的股票的市場加權平均回報。
Have feedback on this article? Concerned about the content? Get in touch with us directly. Alternatively, email editorial-team (at) simplywallst.com.
This article by Simply Wall St is general in nature. We provide commentary based on historical data and analyst forecasts only using an unbiased methodology and our articles are not intended to be financial advice. It does not constitute a recommendation to buy or sell any stock, and does not take account of your objectives, or your financial situation. We aim to bring you long-term focused analysis driven by fundamental data. Note that our analysis may not factor in the latest price-sensitive company announcements or qualitative material. Simply Wall St has no position in any stocks mentioned.
對本文有反饋?關於內容有所顧慮?直接和我們聯繫。或者,發送電子郵件至editorial-team (at) simplywallst.com。
這篇文章是Simply Wall St的一般性文章。我們根據歷史數據和分析師預測提供評論,只使用公正的方法論,我們的文章並不意味着提供任何金融建議。文章不構成買賣任何股票的建議,也不考慮您的目標或您的財務狀況。我們的目標是帶給您基本數據驅動的長期關注分析。請注意,我們的分析可能不考慮最新的價格敏感公司公告或定性材料。Simply Wall St沒有任何股票頭寸。
Have feedback on this article? Concerned about the content? Get in touch with us directly. Alternatively, email editorial-team@simplywallst.com
對本文有反饋?關於內容有所顧慮?直接和我們聯繫。或者發送電子郵件至editorial-team@simplywallst.com。
譯文內容由第三人軟體翻譯。