
Oxford Industries, Inc.'s (NYSE:OXM) Stock Has Shown Weakness Lately But Financial Prospects Look Decent: Is The Market Wrong?
Oxford Industries, Inc.'s (NYSE:OXM) Stock Has Shown Weakness Lately But Financial Prospects Look Decent: Is The Market Wrong?
With its stock down 11% over the past month, it is easy to disregard Oxford Industries (NYSE:OXM). However, stock prices are usually driven by a company's financials over the long term, which in this case look pretty respectable. Particularly, we will be paying attention to Oxford Industries' ROE today.
過去一個月股價下跌11%,很容易忽略紐交所牛津工業(NYSE:OXM)。然而,股票價格通常受公司長期的財務狀況的影響,在這種情況下看起來相當可觀。特別是,今天我們將關注牛津工業的roe。
ROE or return on equity is a useful tool to assess how effectively a company can generate returns on the investment it received from its shareholders. In simpler terms, it measures the profitability of a company in relation to shareholder's equity.
roe指股東權益回報率,是一種有用的工具,用於評估公司如何有效地從股東獲得的投資中產生回報。簡單來說,這衡量了一家公司相對於股東權益的盈利能力。
How Do You Calculate Return On Equity?
怎樣計算ROE?
The formula for ROE is:
roe的公式是:
Return on Equity = Net Profit (from continuing operations) ÷ Shareholders' Equity
淨資產收益率 = 淨利潤(從持續經營中獲得)÷ 股東權益
So, based on the above formula, the ROE for Oxford Industries is:
因此,根據上述公式,牛津工業的ROE爲:
6.8% = US$41m ÷ US$593m (Based on the trailing twelve months to May 2024).
6.8% = 4,100萬美元 ÷ 5.93億美元(基於截至2024年5月的過去十二個月)。
The 'return' is the income the business earned over the last year. Another way to think of that is that for every $1 worth of equity, the company was able to earn $0.07 in profit.
‘return’是這家企業在過去一年裏的收益。換句話說,對於每一美元的淨資產,該公司能夠賺取0.07美元的利潤。
Why Is ROE Important For Earnings Growth?
ROE對於盈利增長的重要性是什麼?
We have already established that ROE serves as an efficient profit-generating gauge for a company's future earnings. Based on how much of its profits the company chooses to reinvest or "retain", we are then able to evaluate a company's future ability to generate profits. Assuming everything else remains unchanged, the higher the ROE and profit retention, the higher the growth rate of a company compared to companies that don't necessarily bear these characteristics.
我們已經確定,roe是一種有效的盈利增長衡量標準,用於評估公司未來盈利的能力,根據公司選擇重新投資或“保留”其利潤的數量,我們可以評估公司未來的盈利能力。假設其他一切不變,roe和利潤保留越高,與沒有這些特徵的公司相比,公司的增長速度就越高。
A Side By Side comparison of Oxford Industries' Earnings Growth And 6.8% ROE
牛津工業的盈利增長與6.8%的roe並排比較。
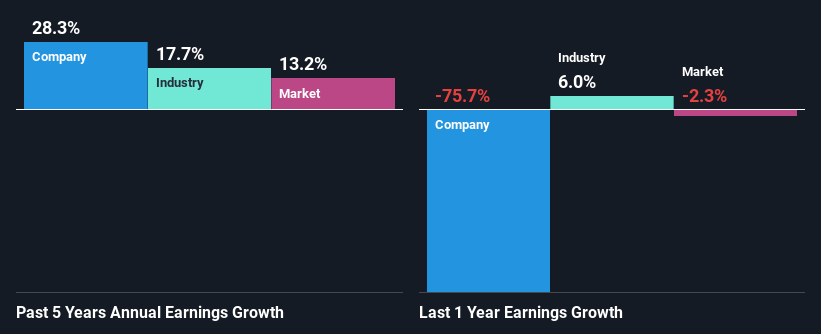
When you first look at it, Oxford Industries' ROE doesn't look that attractive. A quick further study shows that the company's ROE doesn't compare favorably to the industry average of 13% either. However, we we're pleasantly surprised to see that Oxford Industries grew its net income at a significant rate of 28% in the last five years. We reckon that there could be other factors at play here. For example, it is possible that the company's management has made some good strategic decisions, or that the company has a low payout ratio.
當您第一次查看它時,牛津工業的roe並不那麼有吸引力。快速的研究顯示,該公司的roe與13%的行業平均水平不相吻合。但是,令人驚訝的是,在過去五年中,牛津工業的淨利潤以28%的顯着速度增長。我們認爲這裏可能還有其他因素。例如,該公司的管理層可能已經做出了一些不錯的戰略決策,或該公司的股息支付率較低。
As a next step, we compared Oxford Industries' net income growth with the industry, and pleasingly, we found that the growth seen by the company is higher than the average industry growth of 18%.
作爲下一步,我們將牛津工業的淨利潤增長與行業進行了比較,令人高興的是,我們發現該公司的增長率高於行業平均增長率18%。
Earnings growth is an important metric to consider when valuing a stock. It's important for an investor to know whether the market has priced in the company's expected earnings growth (or decline). Doing so will help them establish if the stock's future looks promising or ominous. Is OXM fairly valued? This infographic on the company's intrinsic value has everything you need to know.
盈利增長是估值一隻股票時需要考慮的重要指標。投資者需要知道市場是否已經定價了公司預期的盈利增長(或下降)。這樣做將有助於他們確定該股票的未來前景是有前途還是堪憂。OXM是否公正定價?這張公司內在價值的信息圖表中有您需要了解的一切。
Is Oxford Industries Making Efficient Use Of Its Profits?
牛津工業是否有效地利用了其利潤?
Oxford Industries' ' three-year median payout ratio is on the lower side at 22% implying that it is retaining a higher percentage (78%) of its profits. So it seems like the management is reinvesting profits heavily to grow its business and this reflects in its earnings growth number.
牛津工業的三年中位數股息支付比率處於較低水平,僅爲22%,意味着其留存了更高比例(78%)的利潤。因此,看起來管理層正在大力加大利潤再投資以促進業務增長的力度,這反映在其盈利增長數字上。
Moreover, Oxford Industries is determined to keep sharing its profits with shareholders which we infer from its long history of paying a dividend for at least ten years. Looking at the current analyst consensus data, we can see that the company's future payout ratio is expected to rise to 34% over the next three years.
此外,牛津工業有意繼續與股東分享其利潤,這可以從其至少十年的派息歷史中得出。從當前的分析師共識數據來看,我們可以看到這家公司未來三年的股息支付比率預計將升至34%。
Summary
總的來說,我們對偉明環保的表現非常滿意。具體而言,我們喜歡公司以高回報率再投資了其利潤的很大一部分。當然,這導致公司的收益大幅增長。但是,最新的行業分析師預測表明,該公司的收益預計將加速增長。
Overall, we feel that Oxford Industries certainly does have some positive factors to consider. With a high rate of reinvestment, albeit at a low ROE, the company has managed to see a considerable growth in its earnings. That being so, the latest analyst forecasts show that the company will continue to see an expansion in its earnings. To know more about the latest analysts predictions for the company, check out this visualization of analyst forecasts for the company.
總的來說,我們認爲牛津工業確實有一些值得考慮的積極因素。雖然roe走低,但高比率的再投資使公司的盈利大幅增長。然而,最新的分析師預測顯示,該公司將繼續看到其盈利增長。要了解有關公司最新分析師預測的更多信息,請查看該公司的分析師預測可視化。
Have feedback on this article? Concerned about the content? Get in touch with us directly. Alternatively, email editorial-team (at) simplywallst.com.
This article by Simply Wall St is general in nature. We provide commentary based on historical data and analyst forecasts only using an unbiased methodology and our articles are not intended to be financial advice. It does not constitute a recommendation to buy or sell any stock, and does not take account of your objectives, or your financial situation. We aim to bring you long-term focused analysis driven by fundamental data. Note that our analysis may not factor in the latest price-sensitive company announcements or qualitative material. Simply Wall St has no position in any stocks mentioned.
對本文有反饋?關於內容有所顧慮?直接和我們聯繫。或者,發送電子郵件至editorial-team (at) simplywallst.com。
這篇文章是Simply Wall St的一般性文章。我們根據歷史數據和分析師預測提供評論,只使用公正的方法論,我們的文章並不意味着提供任何金融建議。文章不構成買賣任何股票的建議,也不考慮您的目標或您的財務狀況。我們的目標是帶給您基本數據驅動的長期關注分析。請注意,我們的分析可能不考慮最新的價格敏感公司公告或定性材料。Simply Wall St沒有任何股票頭寸。
Have feedback on this article? Concerned about the content? Get in touch with us directly. Alternatively, email editorial-team@simplywallst.com
對本文有反饋?關於內容有所顧慮?直接和我們聯繫。或者發送電子郵件至editorial-team@simplywallst.com。
譯文內容由第三人軟體翻譯。