
Investing in Eagle Materials (NYSE:EXP) Five Years Ago Would Have Delivered You a 151% Gain
Investing in Eagle Materials (NYSE:EXP) Five Years Ago Would Have Delivered You a 151% Gain
It hasn't been the best quarter for Eagle Materials Inc. (NYSE:EXP) shareholders, since the share price has fallen 19% in that time. But that doesn't change the fact that shareholders have received really good returns over the last five years. It's fair to say most would be happy with 145% the gain in that time. So while it's never fun to see a share price fall, it's important to look at a longer time horizon. Ultimately business performance will determine whether the stock price continues the positive long term trend.
對於鷹材料公司(紐約證券交易所代碼:EXP)股東來說,這並不是最好的季度,因爲當時股價已經下跌了19%。但這並不能改變股東在過去五年中獲得了非常不錯的回報的事實。可以公平地說,大多數人會對當時的145%的漲幅感到滿意。因此,儘管看到股價下跌從來都不是一件好事,但重要的是要着眼於更長的時間跨度。最終,業務表現將決定股價是否延續長期的積極趨勢。
Now it's worth having a look at the company's fundamentals too, because that will help us determine if the long term shareholder return has matched the performance of the underlying business.
現在也值得一看公司的基本面,因爲這將有助於我們確定長期股東回報是否與基礎業務的表現相匹配。
To paraphrase Benjamin Graham: Over the short term the market is a voting machine, but over the long term it's a weighing machine. One flawed but reasonable way to assess how sentiment around a company has changed is to compare the earnings per share (EPS) with the share price.
用本傑明·格雷厄姆的話來說:從短期來看,市場是一臺投票機器,但從長遠來看,它是一臺稱重機。評估公司情緒變化的一種有缺陷但合理的方法是將每股收益(EPS)與股價進行比較。
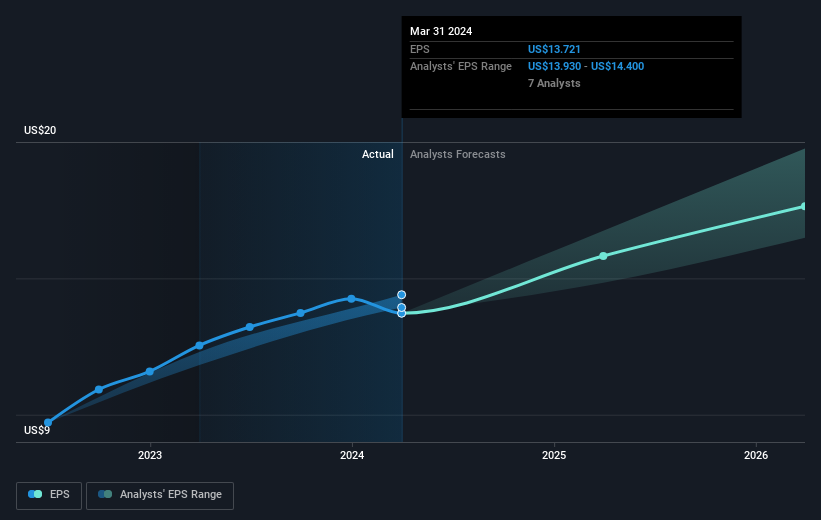
During five years of share price growth, Eagle Materials achieved compound earnings per share (EPS) growth of 24% per year. This EPS growth is higher than the 20% average annual increase in the share price. So it seems the market isn't so enthusiastic about the stock these days.
在五年的股價增長中,Eagle Materials實現了每年24%的複合每股收益(EPS)增長。每股收益的增長高於股價年均增長20%。因此,如今市場似乎對該股並不那麼熱情。
The graphic below depicts how EPS has changed over time (unveil the exact values by clicking on the image).
下圖描述了 EPS 隨着時間的推移是如何變化的(點擊圖片可以看到確切的值)。
Before buying or selling a stock, we always recommend a close examination of historic growth trends, available here.
在買入或賣出股票之前,我們始終建議仔細研究歷史增長趨勢,可在此處查閱。
What About Dividends?
分紅呢?
When looking at investment returns, it is important to consider the difference between total shareholder return (TSR) and share price return. The TSR incorporates the value of any spin-offs or discounted capital raisings, along with any dividends, based on the assumption that the dividends are reinvested. It's fair to say that the TSR gives a more complete picture for stocks that pay a dividend. As it happens, Eagle Materials' TSR for the last 5 years was 151%, which exceeds the share price return mentioned earlier. This is largely a result of its dividend payments!
在考慮投資回報時,重要的是要考慮兩者之間的區別 股東總回報 (TSR) 和 股價回報。基於股息再投資的假設,股東總回報率納入了任何分拆或貼現資本籌集的價值以及任何股息。可以公平地說,股東總回報率爲支付股息的股票提供了更完整的畫面。碰巧的是,Eagle Materials在過去5年的股東總回報率爲151%,超過了前面提到的股價回報率。這在很大程度上是其股息支付的結果!
A Different Perspective
不同的視角
Eagle Materials shareholders gained a total return of 16% during the year. But that return falls short of the market. If we look back over five years, the returns are even better, coming in at 20% per year for five years. Maybe the share price is just taking a breather while the business executes on its growth strategy. While it is well worth considering the different impacts that market conditions can have on the share price, there are other factors that are even more important. To that end, you should be aware of the 1 warning sign we've spotted with Eagle Materials .
鷹材料的股東在年內獲得了16%的總回報。但是這種回報不及市場。如果我們回顧五年,回報率甚至更高,五年內每年爲20%。也許在企業執行增長戰略的同時,股價只是在稍作休息。儘管市場狀況可能對股價產生的不同影響值得考慮,但還有其他因素更爲重要。爲此,你應該注意我們在 Eagle Materials 中發現的 1 個警告標誌。
Of course Eagle Materials may not be the best stock to buy. So you may wish to see this free collection of growth stocks.
當然,鷹材料可能不是最值得購買的股票。因此,您可能希望看到這批免費的成長股。
Please note, the market returns quoted in this article reflect the market weighted average returns of stocks that currently trade on American exchanges.
請注意,本文引用的市場回報反映了目前在美國交易所交易的股票的市場加權平均回報。
Have feedback on this article? Concerned about the content? Get in touch with us directly. Alternatively, email editorial-team (at) simplywallst.com.
This article by Simply Wall St is general in nature. We provide commentary based on historical data and analyst forecasts only using an unbiased methodology and our articles are not intended to be financial advice. It does not constitute a recommendation to buy or sell any stock, and does not take account of your objectives, or your financial situation. We aim to bring you long-term focused analysis driven by fundamental data. Note that our analysis may not factor in the latest price-sensitive company announcements or qualitative material. Simply Wall St has no position in any stocks mentioned.
對這篇文章有反饋嗎?對內容感到擔憂?直接聯繫我們。 或者,給編輯團隊 (at) simplywallst.com 發送電子郵件。
Simply Wall St的這篇文章本質上是籠統的。我們僅使用公正的方法根據歷史數據和分析師的預測提供評論,我們的文章無意作爲財務建議。它不構成買入或賣出任何股票的建議,也沒有考慮到您的目標或財務狀況。我們的目標是爲您提供由基本數據驅動的長期重點分析。請注意,我們的分析可能不考慮最新的價格敏感型公司公告或定性材料。簡而言之,華爾街沒有持有任何上述股票的頭寸。
Have feedback on this article? Concerned about the content? Get in touch with us directly. Alternatively, email editorial-team@simplywallst.com
對這篇文章有反饋嗎?對內容感到擔憂?直接聯繫我們。 或者,發送電子郵件至 editorial-team@simplywallst.com
譯文內容由第三人軟體翻譯。