
These 4 Measures Indicate That Cencora (NYSE:COR) Is Using Debt Reasonably Well
These 4 Measures Indicate That Cencora (NYSE:COR) Is Using Debt Reasonably Well
Warren Buffett famously said, 'Volatility is far from synonymous with risk.' So it seems the smart money knows that debt - which is usually involved in bankruptcies - is a very important factor, when you assess how risky a company is. Importantly, Cencora, Inc. (NYSE:COR) does carry debt. But is this debt a concern to shareholders?
禾倫·巴菲特曾經說過,‘波動性與風險遠非同義詞’。所以聰明的投資人知道,債務通常涉及破產,是評估一家公司風險的重要因素之一。值得注意的是,Cencora股份有限公司(紐交所:COR)確實承擔了債務。但這些債務是否對股東構成了風險值得考慮。
Why Does Debt Bring Risk?
爲什麼債務會帶來風險?
Generally speaking, debt only becomes a real problem when a company can't easily pay it off, either by raising capital or with its own cash flow. If things get really bad, the lenders can take control of the business. However, a more frequent (but still costly) occurrence is where a company must issue shares at bargain-basement prices, permanently diluting shareholders, just to shore up its balance sheet. By replacing dilution, though, debt can be an extremely good tool for businesses that need capital to invest in growth at high rates of return. When we examine debt levels, we first consider both cash and debt levels, together.
一般來說,只有在公司無法輕鬆償還債務時,通過籌集資本或利用自己的經營現金流,債務才會成爲真正的問題。 如果情況變得非常糟糕,貸款人可以控制該企業。 然而,一種更頻繁(但仍然代價高昂)的情況是,公司必須以白菜價發行股票,以加強其資產負債表,從而永久性地稀釋股東。 然而,通過取代稀釋,債務可以成爲需要高回報率投資增長的企業的極好工具。 當我們審查債務水平時,首先考慮現金和債務水平。
What Is Cencora's Net Debt?
Cencora的淨債務是多少?
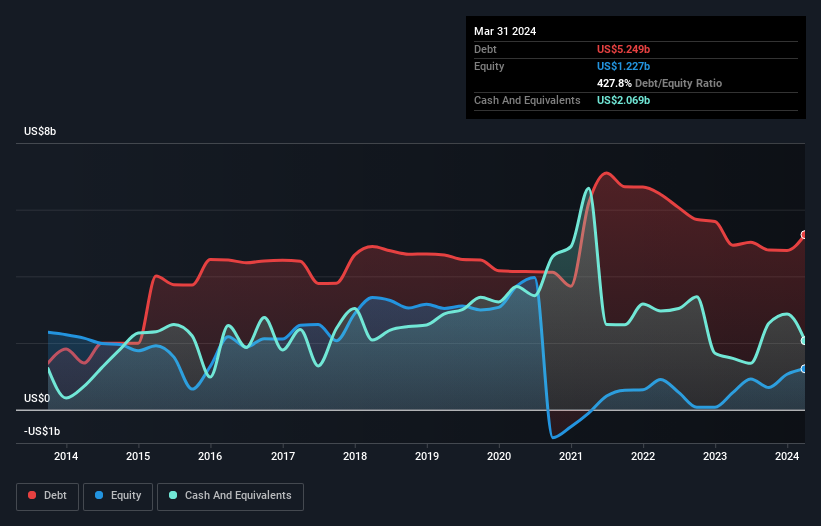
As you can see below, at the end of March 2024, Cencora had US$5.25b of debt, up from US$4.93b a year ago. Click the image for more detail. However, because it has a cash reserve of US$2.07b, its net debt is less, at about US$3.18b.
正如下圖所示,在2024年3月底,Cencora的債務總額爲52.5億美元,比一年前的49.3億美元增加。然而,由於它擁有20.7億美元的現金儲備,其淨債務較小,約爲31.8億美元。點擊圖像以獲取更多細節。
A Look At Cencora's Liabilities
看一下Cencora的負債情況。
According to the last reported balance sheet, Cencora had liabilities of US$49.8b due within 12 months, and liabilities of US$12.9b due beyond 12 months. On the other hand, it had cash of US$2.07b and US$22.8b worth of receivables due within a year. So its liabilities outweigh the sum of its cash and (near-term) receivables by US$37.8b.
根據最後公佈的資產負債表,Cencora有498億美元的負債到期日在12個月內,還有129億美元的負債到期日在12個月以後。另一方面,它在一年內有20.7億美元的現金和228億美元的應收賬款。因此,它的負債超過其現金和(短期)應收賬款的總和378億美元。
This is a mountain of leverage even relative to its gargantuan market capitalization of US$44.4b. Should its lenders demand that it shore up the balance sheet, shareholders would likely face severe dilution.
這是巨大的負債,與其440億美元的市值相比甚微。如果其債權人要求其加強資產負債表,股東可能面臨重大稀釋。
We measure a company's debt load relative to its earnings power by looking at its net debt divided by its earnings before interest, tax, depreciation, and amortization (EBITDA) and by calculating how easily its earnings before interest and tax (EBIT) cover its interest expense (interest cover). This way, we consider both the absolute quantum of the debt, as well as the interest rates paid on it.
我們通過查看淨債務除以利息、稅、折舊和攤銷前的收益(EBITDA)並計算其利息費用(利息覆蓋)來相對衡量公司的負債水平。這樣,我們考慮債務的絕對規模以及支付的利息費用。
Cencora has a low net debt to EBITDA ratio of only 0.81. And its EBIT easily covers its interest expense, being 12.7 times the size. So you could argue it is no more threatened by its debt than an elephant is by a mouse. Also good is that Cencora grew its EBIT at 11% over the last year, further increasing its ability to manage debt. There's no doubt that we learn most about debt from the balance sheet. But ultimately the future profitability of the business will decide if Cencora can strengthen its balance sheet over time. So if you want to see what the professionals think, you might find this free report on analyst profit forecasts to be interesting.
Cencora的淨債務與息稅前利潤EBITDA比率僅有0.81。而其息稅前利潤EBIT輕鬆覆蓋了利息支出,規模爲其12.7倍。因此,你可以認爲它受債務威脅的程度不比大象受老鼠的威脅要大。另一個好消息是Cencora在過去一年中EBIT增長了11%,從而進一步增加了其管理債務的能力。毫無疑問,我們從資產負債表上可以了解到債務的大部分情況。但最終,公司未來的盈利能力將決定Cencora是否能夠隨着時間的推移增強其資產負債表。因此,如果你想知道專業人士的想法,你可能會發現這份免費的分析師利潤預測報告很有趣。
Finally, a business needs free cash flow to pay off debt; accounting profits just don't cut it. So the logical step is to look at the proportion of that EBIT that is matched by actual free cash flow. Over the last three years, Cencora recorded free cash flow worth a fulsome 89% of its EBIT, which is stronger than we'd usually expect. That puts it in a very strong position to pay down debt.
最後,公司需要自由現金流來償還債務;僅靠會計利潤是不夠的。因此,邏輯步驟是查看EBIT中實際自由現金流所佔比例。在過去的三年中,Cencora記錄下了價值豐厚的89%的EBIT來自實際自由現金流,這強於我們通常的預期。這讓它處於非常強大的償債地位。
Our View
我們的觀點
Happily, Cencora's impressive interest cover implies it has the upper hand on its debt. But, on a more sombre note, we are a little concerned by its level of total liabilities. We would also note that Healthcare industry companies like Cencora commonly do use debt without problems. Taking all this data into account, it seems to us that Cencora takes a pretty sensible approach to debt. That means they are taking on a bit more risk, in the hope of boosting shareholder returns. When analysing debt levels, the balance sheet is the obvious place to start. But ultimately, every company can contain risks that exist outside of the balance sheet. These risks can be hard to spot. Every company has them, and we've spotted 1 warning sign for Cencora you should know about.
令人高興的是,Cencora令人印象深刻的利息覆蓋率意味着它在債務上佔據了主導地位。但更令人沮喪的是,我們對其總負債水平有些擔憂。我們還應該注意到,像Cencora這樣的醫療保健行業公司通常不會出現債務問題。考慮到所有這些數據,我們認爲Cencora在債務方面採取了相當明智的做法。這意味着他們承擔了更多的風險,希望提高股東的回報率。在分析債務水平時,資產負債表是最明顯的起點。但最終,每個公司都可能存在超出資產負債表之外的風險。這些風險可能很難發現。每個公司都有這些風險,我們還發現了Cencora的一個警告信號,你應該知道。
If, after all that, you're more interested in a fast growing company with a rock-solid balance sheet, then check out our list of net cash growth stocks without delay.
如果您在所有這些工作之後,更感興趣於擁有堅實資產負債表的快速發展公司,請立即查看我們的淨現金成長股列表。
Have feedback on this article? Concerned about the content? Get in touch with us directly. Alternatively, email editorial-team (at) simplywallst.com.
This article by Simply Wall St is general in nature. We provide commentary based on historical data and analyst forecasts only using an unbiased methodology and our articles are not intended to be financial advice. It does not constitute a recommendation to buy or sell any stock, and does not take account of your objectives, or your financial situation. We aim to bring you long-term focused analysis driven by fundamental data. Note that our analysis may not factor in the latest price-sensitive company announcements or qualitative material. Simply Wall St has no position in any stocks mentioned.
對本文有反饋?關於內容有所顧慮?直接和我們聯繫。或者,發送電子郵件至editorial-team (at) simplywallst.com。
這篇文章是Simply Wall St的一般性文章。我們根據歷史數據和分析師預測提供評論,只使用公正的方法論,我們的文章並不意味着提供任何金融建議。文章不構成買賣任何股票的建議,也不考慮您的目標或您的財務狀況。我們的目標是帶給您基本數據驅動的長期關注分析。請注意,我們的分析可能不考慮最新的價格敏感公司公告或定性材料。Simply Wall St沒有任何股票頭寸。
Have feedback on this article? Concerned about the content? Get in touch with us directly. Alternatively, email editorial-team@simplywallst.com
對本文有反饋?關於內容有所顧慮?直接和我們聯繫。或者發送電子郵件至editorial-team@simplywallst.com。
譯文內容由第三人軟體翻譯。