
Eli Lilly Soars To 52-Week High: Can The Momentum Continue?
Eli Lilly Soars To 52-Week High: Can The Momentum Continue?
Eli Lilly and Company (NYSE:LLY) has hit a new 52-week high, climbing to $915.54 during Friday trading. The stock is up a remarkable 97.38% over the past year and 55.32% year-to-date, fueled by groundbreaking collaborations and bullish technical indicators.
Eli Lilly and Company (紐交所:LLY) 達到了52周新高,在上週五交易期間攀升至915.54美元。股票在過去一年中上漲了97.38%,年初至今上漲了55.32%,得益於開創性的合作和看好的技術指標。
Eli Lilly's Game-Changing Partnership With OpenAI
Eli Lilly與OpenAI的重大合作
Eli Lilly announced a collaboration with Microsoft Corp-backed (NASDAQ:MSFT) OpenAI to develop novel antimicrobials to combat drug-resistant pathogens. Diogo Rau, Lilly's executive vice president and chief information and digital officer, emphasized that generative AI will accelerate the discovery of new treatments, underscoring the company's commitment to addressing significant health challenges.
Eli Lilly宣佈與微軟公司(NASDAQ:MSFT)支持的OpenAI合作,開發新型抗微生物藥物以對抗耐藥病原體。Eli Lilly的行政副總裁兼首席信息和數字官員Diogo Rau強調,生成式人工智能將加速新治療方法的發現,突顯公司解決重大健康挑戰的承諾。
Read Also: What's Going On With Eli Lilly Stock?
閱讀也可以這樣:Eli Lilly股票怎麼回事?
LLY Stock Chart Indicates More Momentum Ahead
LLY股票圖表顯示勢頭更多
Eli Lilly's technical indicators paint a bullish picture. The stock is trading above its 5, 20 and 50-day exponential moving averages, signaling strong upward momentum.
Eli Lilly的技術指標呈現出看好的畫面。股票正在交易上漲其5、20和50天指數移動平均線之上,表明着強勁的向上動量。
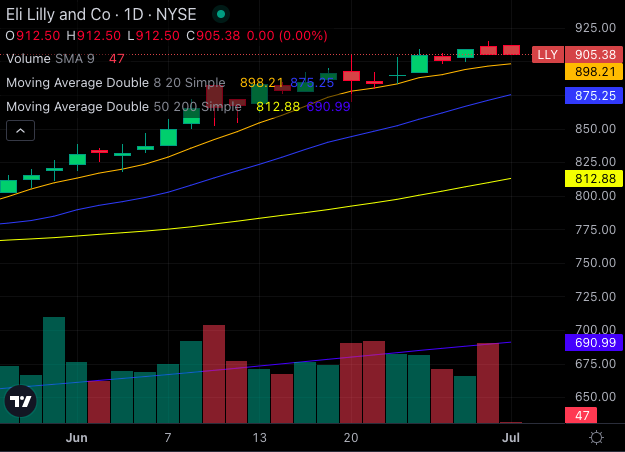
Chart was created using Benzinga Pro
圖表使用Benzinga Pro創建
With the share price at $905.38, well above key moving averages—$898.21 (8-day), $875.25 (20-day), $812.88 (50-day) and $690.99 (200-day)—the trend appears robust.
隨着股價達到905.38美元,遠高於關鍵的移動平均線(8日均線爲898.21美元,20日均線爲875.25美元,50日均線爲812.88美元和200日均線爲690.99美元),趨勢看起來非常強勁。
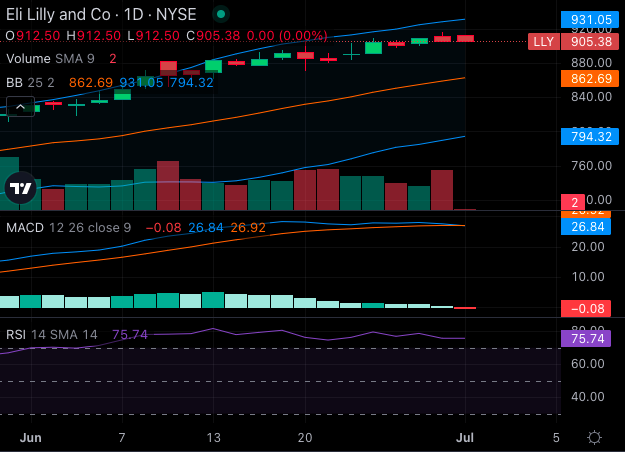
Chart was created using Benzinga Pro
圖表使用Benzinga Pro創建
The Moving Average Convergence Divergence (MACD) indicator stands at 26.84, reinforcing the bullish signal. However, the Relative Strength Index (RSI) of 75.74 suggests the stock is overbought, indicating potential near-term volatility.
移動平均線收斂/發散(MACD)指標爲26.84,增強了多頭信號。然而,相對強弱指數(RSI)爲75.74,表明股票超買,可能出現短期波動。
Bollinger Bands further support the bullish outlook, with the 25-day bands ranging from $794.32 to $931.05, suggesting bullish momentum towards Eli Lilly's stock.
這裏的Bollinger Bands(布林帶)更進一步支持看好的前景,25天價格波動區間在$794.32到$931.05之間,表明Eli Lilly的股票有延續多頭趨勢的機會。
Indicators Suggest Continues Momentum
指標表明有持續的動量
Eli Lilly's strategic initiatives and strong technical indicators suggest continued momentum. The collaboration with OpenAI could catalyze further innovation and growth, reinforcing the company's position in the fight against drug-resistant pathogens.
Eli Lilly的戰略舉措和強勁的技術指標表明將持續勢頭。與OpenAI的合作可能會催化進一步的創新和增長,強化該公司在對抗耐藥性病原體方面的地位。
Investors will be keenly watching to see if Eli Lilly can sustain its upward trajectory and continue delivering on its ambitious goals. Stay tuned as this pharmaceutical giant continues to push boundaries and reach new heights.
投資者將會密切關注Eli Lilly能否保持其上升曲線並繼續實現其宏偉目標。請繼續關注這家制藥巨頭推陳出新並不斷攀升。
- Will Novo Nordisk Building Fires Serve As A Catalyst For Eli Lilly? Redditors See A Stock Split For US Company 'Very Likely'
- 諾和諾德樓房火災會成爲禮來公司的催化劑嗎? Reddit用戶認爲美國公司要進行股票分割的可能性非常大。
譯文內容由第三人軟體翻譯。