
Those Who Invested in RLI (NYSE:RLI) Five Years Ago Are up 88%
Those Who Invested in RLI (NYSE:RLI) Five Years Ago Are up 88%
If you buy and hold a stock for many years, you'd hope to be making a profit. But more than that, you probably want to see it rise more than the market average. Unfortunately for shareholders, while the RLI Corp. (NYSE:RLI) share price is up 61% in the last five years, that's less than the market return. Zooming in, the stock is up just 3.2% in the last year.
如果你買入並持有股票多年,你希望獲利。但不僅如此,你可能希望看到它的漲幅超過市場平均水平。對於股東來說,不幸的是,儘管RLI公司(紐約證券交易所代碼:RLI)的股價在過去五年中上漲了61%,但仍低於市場回報率。放大,該股去年僅上漲了3.2%。
Now it's worth having a look at the company's fundamentals too, because that will help us determine if the long term shareholder return has matched the performance of the underlying business.
現在也值得一看公司的基本面,因爲這將有助於我們確定長期股東回報是否與基礎業務的表現相匹配。
There is no denying that markets are sometimes efficient, but prices do not always reflect underlying business performance. One flawed but reasonable way to assess how sentiment around a company has changed is to compare the earnings per share (EPS) with the share price.
不可否認,市場有時是有效的,但價格並不總是能反映潛在的業務表現。評估公司情緒變化的一種有缺陷但合理的方法是將每股收益(EPS)與股價進行比較。
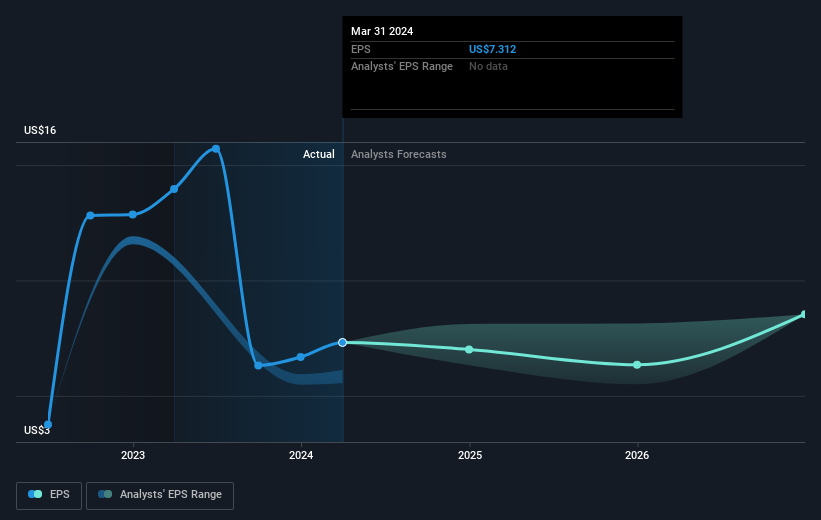
Over half a decade, RLI managed to grow its earnings per share at 23% a year. The EPS growth is more impressive than the yearly share price gain of 10% over the same period. So one could conclude that the broader market has become more cautious towards the stock.
在過去的五年中,RLI設法將其每股收益增長到每年23%。每股收益的增長比同期10%的年度股價增長更令人印象深刻。因此,人們可以得出結論,整個市場對該股變得更加謹慎。
You can see below how EPS has changed over time (discover the exact values by clicking on the image).
你可以在下面看到 EPS 是如何隨着時間的推移而變化的(點擊圖片發現確切的值)。
This free interactive report on RLI's earnings, revenue and cash flow is a great place to start, if you want to investigate the stock further.
如果你想進一步調查該股,這份關於RLI收益、收入和現金流的免費互動報告是一個很好的起點。
What About Dividends?
分紅呢?
When looking at investment returns, it is important to consider the difference between total shareholder return (TSR) and share price return. The TSR incorporates the value of any spin-offs or discounted capital raisings, along with any dividends, based on the assumption that the dividends are reinvested. It's fair to say that the TSR gives a more complete picture for stocks that pay a dividend. In the case of RLI, it has a TSR of 88% for the last 5 years. That exceeds its share price return that we previously mentioned. This is largely a result of its dividend payments!
在考慮投資回報時,重要的是要考慮兩者之間的區別 股東總回報 (TSR) 和 股價回報。基於股息再投資的假設,股東總回報率納入了任何分拆或貼現資本籌集的價值以及任何股息。可以公平地說,股東總回報率爲支付股息的股票提供了更完整的畫面。就RLI而言,在過去5年的股東回報率爲88%。這超過了我們之前提到的其股價回報率。這在很大程度上是其股息支付的結果!
A Different Perspective
不同的視角
RLI provided a TSR of 5.6% over the last twelve months. But that return falls short of the market. If we look back over five years, the returns are even better, coming in at 13% per year for five years. It's quite possible the business continues to execute with prowess, even as the share price gains are slowing. It's always interesting to track share price performance over the longer term. But to understand RLI better, we need to consider many other factors. To that end, you should learn about the 2 warning signs we've spotted with RLI (including 1 which is a bit concerning) .
在過去的十二個月中,RLI的股東回報率爲5.6%。但是這種回報不及市場。如果我們回顧五年,回報率甚至更高,五年內每年爲13%。儘管股價上漲放緩,但該業務很有可能繼續保持強勁的執行力。長期跟蹤股價表現總是很有意思的。但是,爲了更好地了解RLI,我們需要考慮許多其他因素。爲此,你應該了解我們在RLI中發現的2個警告信號(包括一個有點令人擔憂)。
Of course, you might find a fantastic investment by looking elsewhere. So take a peek at this free list of companies we expect will grow earnings.
當然,通過尋找其他地方,你可能會找到一筆不錯的投資。因此,請看一下我們預計收益將增加的這份免費公司名單。
Please note, the market returns quoted in this article reflect the market weighted average returns of stocks that currently trade on American exchanges.
請注意,本文引用的市場回報反映了目前在美國交易所交易的股票的市場加權平均回報。
Have feedback on this article? Concerned about the content? Get in touch with us directly. Alternatively, email editorial-team (at) simplywallst.com.
This article by Simply Wall St is general in nature. We provide commentary based on historical data and analyst forecasts only using an unbiased methodology and our articles are not intended to be financial advice. It does not constitute a recommendation to buy or sell any stock, and does not take account of your objectives, or your financial situation. We aim to bring you long-term focused analysis driven by fundamental data. Note that our analysis may not factor in the latest price-sensitive company announcements or qualitative material. Simply Wall St has no position in any stocks mentioned.
對這篇文章有反饋嗎?對內容感到擔憂?直接聯繫我們。 或者,給編輯團隊 (at) simplywallst.com 發送電子郵件。
Simply Wall St的這篇文章本質上是籠統的。我們僅使用公正的方法根據歷史數據和分析師的預測提供評論,我們的文章無意作爲財務建議。它不構成買入或賣出任何股票的建議,也沒有考慮到您的目標或財務狀況。我們的目標是爲您提供由基本數據驅動的長期重點分析。請注意,我們的分析可能不考慮最新的價格敏感型公司公告或定性材料。簡而言之,華爾街沒有持有任何上述股票的頭寸。
Have feedback on this article? Concerned about the content? Get in touch with us directly. Alternatively, email editorial-team@simplywallst.com
對這篇文章有反饋嗎?對內容感到擔憂?直接聯繫我們。 或者,發送電子郵件至 editorial-team@simplywallst.com
譯文內容由第三人軟體翻譯。