
The Three-year Loss for First Bancshares (NYSE:FBMS) Shareholders Likely Driven by Its Shrinking Earnings
The Three-year Loss for First Bancshares (NYSE:FBMS) Shareholders Likely Driven by Its Shrinking Earnings
For many investors, the main point of stock picking is to generate higher returns than the overall market. But if you try your hand at stock picking, you risk returning less than the market. We regret to report that long term The First Bancshares, Inc. (NYSE:FBMS) shareholders have had that experience, with the share price dropping 30% in three years, versus a market return of about 18%. On the other hand the share price has bounced 8.5% over the last week.
對於許多投資者來說,股票選擇的主要目的是創造比整個市場更高的回報。但是,如果您嘗試選股,風險是回報低於市場。我們遺憾地報告了長揸The First Bancshares, Inc.(NYSE:FBMS)股票的股東已經有了這種經驗,股價在三年內下跌了30%,而市場回報約爲18%。另一方面,股價在上週反彈了8.5%。
The recent uptick of 8.5% could be a positive sign of things to come, so let's take a look at historical fundamentals.
最近的8.5%上漲可能是好事的積極表現,因此讓我們來看看歷史基本面。
There is no denying that markets are sometimes efficient, but prices do not always reflect underlying business performance. One imperfect but simple way to consider how the market perception of a company has shifted is to compare the change in the earnings per share (EPS) with the share price movement.
不可否認的是,市場有時是高效的,但價格並不總是反映潛在的商業表現。一個不完美但簡單的方法來考慮公司市場感知如何改變是比較每股收益(EPS)變化和股價變動。
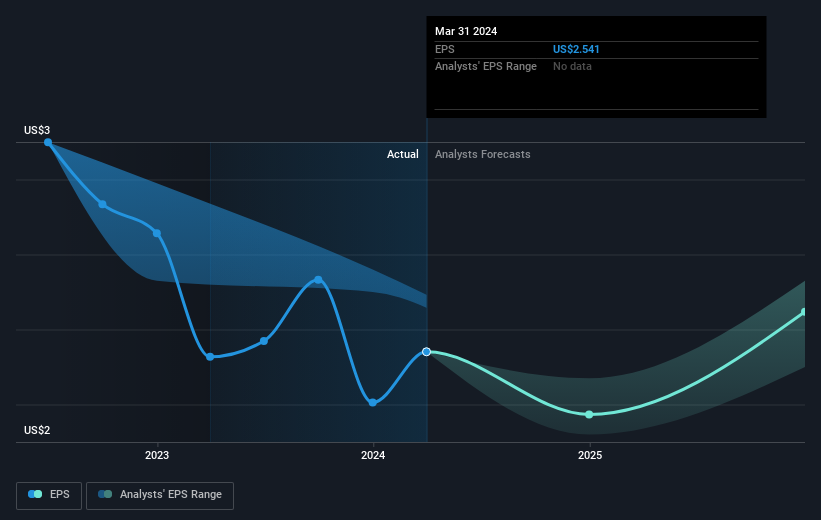
First Bancshares saw its EPS decline at a compound rate of 3.7% per year, over the last three years. The share price decline of 11% is actually steeper than the EPS slippage. So it's likely that the EPS decline has disappointed the market, leaving investors hesitant to buy. The less favorable sentiment is reflected in its current P/E ratio of 10.16.
在過去的三年中,First Bancshares的EPS以每年3.7%的複合增長率下降。股價下跌11%實際上比EPS的下降更爲嚴重。因此,EPS的下降很可能讓市場失望,讓投資者猶豫不決。其不利的情緒反映在其目前的市盈率爲10.16。
The graphic below depicts how EPS has changed over time (unveil the exact values by clicking on the image).
下圖顯示了EPS隨時間變化的情況(點擊圖像以顯示確切值)。
Dive deeper into First Bancshares' key metrics by checking this interactive graph of First Bancshares's earnings, revenue and cash flow.
通過檢查First Bancshares的收益、營業收入和現金流互動圖,更深入地了解First Bancshares的主要指標。
What About Dividends?
那麼分紅怎麼樣呢?
When looking at investment returns, it is important to consider the difference between total shareholder return (TSR) and share price return. The TSR is a return calculation that accounts for the value of cash dividends (assuming that any dividend received was reinvested) and the calculated value of any discounted capital raisings and spin-offs. It's fair to say that the TSR gives a more complete picture for stocks that pay a dividend. We note that for First Bancshares the TSR over the last 3 years was -24%, which is better than the share price return mentioned above. The dividends paid by the company have thusly boosted the total shareholder return.
在考慮投資回報時,重要的是考慮總股東回報(TSR)和股票回報之間的差異。 TSR包括任何剝離或折讓的資本籌集(基於股息被重新投資的假設),以及任何股息。因此,對於支付慷慨的股息公司而言,TSR通常比股票回報高得多。就中國神威藥業集團而言,其TSR在過去5年中達到了75%。這超過了我們之前提到的股票回報。該公司支付的股息已經提高了總股東回報。總股東回報和股票回報TSR是計算回報率的方法,考慮到現金股息的價值(假設收到的任何股息都被再投資),以及任何折扣配股和分拆的計算價值。可以說,TSR爲支付股息的股票提供了更完整的圖片。我們注意到,對於First Bancshares,過去三年的TSR爲-24%,這比上述股價回報更好。公司支付的股息已經提高了股息。總股東回報。
A Different Perspective
不同的觀點
First Bancshares provided a TSR of 4.3% over the last twelve months. But that return falls short of the market. On the bright side, that's still a gain, and it is certainly better than the yearly loss of about 1.1% endured over half a decade. So this might be a sign the business has turned its fortunes around. Before forming an opinion on First Bancshares you might want to consider the cold hard cash it pays as a dividend. This free chart tracks its dividend over time.
First Bancshares提供了過去12個月的4.3%的TSR。但是,回報跑輸了市場。好的一面是,仍然是盈利,肯定比過去半個世紀遭受的約1.1%的年度虧損要好。因此,這可能是企業扭轉命運的跡象。在對First Bancshares形成看法之前,您可能需要考慮其作爲股息所支付的冷靜現金。此免費圖表跟蹤其隨時間變化的股息。
If you would prefer to check out another company -- one with potentially superior financials -- then do not miss this free list of companies that have proven they can grow earnings.
如果您願意查看另一家公司-具有潛在更優質財務狀況的公司-則不要錯過這個免費的公司列表,這些公司已經證明他們可以增長收益。
Please note, the market returns quoted in this article reflect the market weighted average returns of stocks that currently trade on American exchanges.
請注意,本文所引述的市場回報反映了目前在美國交易所上市的股票的市場加權平均回報。
Have feedback on this article? Concerned about the content? Get in touch with us directly. Alternatively, email editorial-team (at) simplywallst.com.
This article by Simply Wall St is general in nature. We provide commentary based on historical data and analyst forecasts only using an unbiased methodology and our articles are not intended to be financial advice. It does not constitute a recommendation to buy or sell any stock, and does not take account of your objectives, or your financial situation. We aim to bring you long-term focused analysis driven by fundamental data. Note that our analysis may not factor in the latest price-sensitive company announcements or qualitative material. Simply Wall St has no position in any stocks mentioned.
對本文有反饋?關於內容有所顧慮?直接和我們聯繫。或者,發送電子郵件至editorial-team (at) simplywallst.com。
這篇文章是Simply Wall St的一般性文章。我們根據歷史數據和分析師預測提供評論,只使用公正的方法論,我們的文章並不意味着提供任何金融建議。文章不構成買賣任何股票的建議,也不考慮您的目標或您的財務狀況。我們的目標是帶給您基本數據驅動的長期關注分析。請注意,我們的分析可能不考慮最新的價格敏感公司公告或定性材料。Simply Wall St沒有任何股票頭寸。
Have feedback on this article? Concerned about the content? Get in touch with us directly. Alternatively, email editorial-team@simplywallst.com
對本文有反饋?關於內容有所顧慮?直接和我們聯繫。或者發送電子郵件至editorial-team@simplywallst.com。
譯文內容由第三人軟體翻譯。