
The Total Return for Silgan Holdings (NYSE:SLGN) Investors Has Risen Faster Than Earnings Growth Over the Last Five Years
The Total Return for Silgan Holdings (NYSE:SLGN) Investors Has Risen Faster Than Earnings Growth Over the Last Five Years
Silgan Holdings Inc. (NYSE:SLGN) shareholders might be concerned after seeing the share price drop 13% in the last quarter. But the silver lining is the stock is up over five years. However we are not very impressed because the share price is only up 34%, less than the market return of 94%.
Silgan Holdings Inc.(紐交所:SLGN)的股東可能會對看到股價在上個季度下跌13%感到擔憂。但好消息是,股票在過去五年已經上漲。然而,我們並不是非常滿意,因爲股價只漲了34%,低於市場回報率的94%。
Although Silgan Holdings has shed US$206m from its market cap this week, let's take a look at its longer term fundamental trends and see if they've driven returns.
雖然Silgan Holdings本週市值已經減少了2.06億美元,但我們可以看看它的長期基本趨勢,以確定其是否產生收益。
There is no denying that markets are sometimes efficient, but prices do not always reflect underlying business performance. One flawed but reasonable way to assess how sentiment around a company has changed is to compare the earnings per share (EPS) with the share price.
市場有時毫無疑問是有效的,但股票價格並不總是反映基本業務表現。一種有缺陷但合理的方法是比較每股收益(EPS)和股票價格,以評估圍繞公司的情緒如何變化。
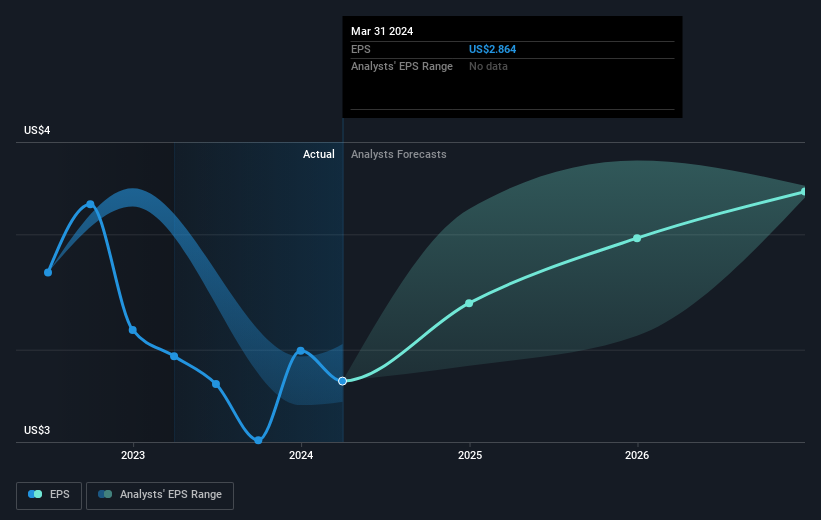
Over half a decade, Silgan Holdings managed to grow its earnings per share at 7.3% a year. This EPS growth is higher than the 6% average annual increase in the share price. Therefore, it seems the market has become relatively pessimistic about the company.
在過去的五年中,Silgan Holdings每股收益以7.3%的年增長率增長。這種EPS增長高於股價的年均增長率6%。因此,市場對該公司的看法變得相對悲觀。
You can see below how EPS has changed over time (discover the exact values by clicking on the image).
下面可以看到每股收益隨時間的變化情況(通過點擊圖像來查看確切數值)。
This free interactive report on Silgan Holdings' earnings, revenue and cash flow is a great place to start, if you want to investigate the stock further.
如果您想進一步調查股票,可以免費互動報告Silgan Holdings的收益,營業收入和現金流。
What About Dividends?
那麼分紅怎麼樣呢?
As well as measuring the share price return, investors should also consider the total shareholder return (TSR). The TSR incorporates the value of any spin-offs or discounted capital raisings, along with any dividends, based on the assumption that the dividends are reinvested. Arguably, the TSR gives a more comprehensive picture of the return generated by a stock. As it happens, Silgan Holdings' TSR for the last 5 years was 44%, which exceeds the share price return mentioned earlier. The dividends paid by the company have thusly boosted the total shareholder return.
除了衡量股價回報率外,投資者還應考慮總股東回報率(TSR)。TSR包括基於紅利再投資的任何股權分拆或折價資本籌集的價值以及任何分紅。可以說,TSR可以更全面地反映股票的收益。事實上,Silgan Holdings過去5年的TSR爲44%,超過了前面提到的股價回報率。公司支付的股息已經提高了。總股東回報。
A Different Perspective
不同的觀點
While the broader market gained around 23% in the last year, Silgan Holdings shareholders lost 8.2% (even including dividends). Even the share prices of good stocks drop sometimes, but we want to see improvements in the fundamental metrics of a business, before getting too interested. On the bright side, long term shareholders have made money, with a gain of 8% per year over half a decade. It could be that the recent sell-off is an opportunity, so it may be worth checking the fundamental data for signs of a long term growth trend. I find it very interesting to look at share price over the long term as a proxy for business performance. But to truly gain insight, we need to consider other information, too. For instance, we've identified 2 warning signs for Silgan Holdings (1 can't be ignored) that you should be aware of.
雖然好股票的股價有時會下跌,但在過去的一年裏,整個市場漲幅約23%,而Silgan Holdings的股東卻虧損了8.2%(包括股息)。但是,長期股東已經賺到錢了,在過去的五年中,平均每年獲得8%的收益率。可能最近的拋售行爲是一個機會,因此可能值得檢查基本數據,以確定長期增長趨勢的跡象。我認爲長期股價是業務績效的代理非常有趣。但爲了真正獲得見解,我們還需要考慮其他信息。例如,我們已經確定了Silgan Holdings的2個警告信號(1個不能忽視),您應該注意。
If you are like me, then you will not want to miss this free list of undervalued small caps that insiders are buying.
如果您像我一樣,就不會希望錯過這份免費的內部人士正在購買的低估小市值股票列表。
Please note, the market returns quoted in this article reflect the market weighted average returns of stocks that currently trade on American exchanges.
請注意,本文所引述的市場回報反映了目前在美國交易所上市的股票的市場加權平均回報。
Have feedback on this article? Concerned about the content? Get in touch with us directly. Alternatively, email editorial-team (at) simplywallst.com.
This article by Simply Wall St is general in nature. We provide commentary based on historical data and analyst forecasts only using an unbiased methodology and our articles are not intended to be financial advice. It does not constitute a recommendation to buy or sell any stock, and does not take account of your objectives, or your financial situation. We aim to bring you long-term focused analysis driven by fundamental data. Note that our analysis may not factor in the latest price-sensitive company announcements or qualitative material. Simply Wall St has no position in any stocks mentioned.
對本文有反饋?關於內容有所顧慮?直接和我們聯繫。或者,發送電子郵件至editorial-team (at) simplywallst.com。
這篇文章是Simply Wall St的一般性文章。我們根據歷史數據和分析師預測提供評論,只使用公正的方法論,我們的文章並不意味着提供任何金融建議。文章不構成買賣任何股票的建議,也不考慮您的目標或您的財務狀況。我們的目標是帶給您基本數據驅動的長期關注分析。請注意,我們的分析可能不考慮最新的價格敏感公司公告或定性材料。Simply Wall St沒有任何股票頭寸。
Have feedback on this article? Concerned about the content? Get in touch with us directly. Alternatively, email editorial-team@simplywallst.com
對本文有反饋?關於內容有所顧慮?直接和我們聯繫。或者發送電子郵件至editorial-team@simplywallst.com。
譯文內容由第三人軟體翻譯。