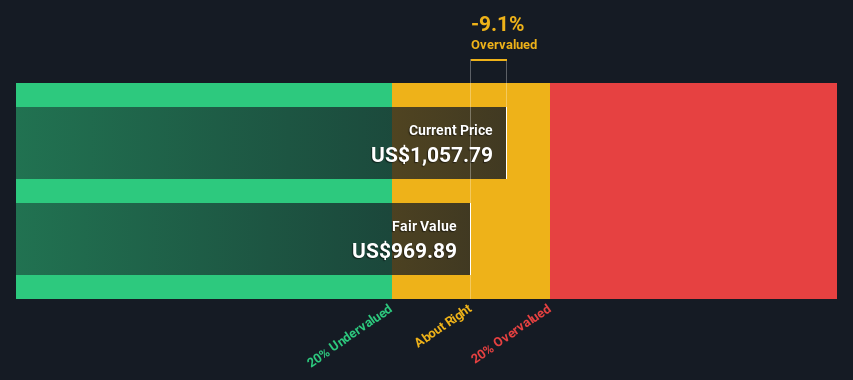
Using the 2 Stage Free Cash Flow to Equity, O'Reilly Automotive fair value estimate is US$970
O'Reilly Automotive's US$1,058 share price indicates it is trading at similar levels as its fair value estimate
The US$1,151 analyst price target for ORLY is 19% more than our estimate of fair value
How far off is O'Reilly Automotive, Inc. (NASDAQ:ORLY) from its intrinsic value? Using the most recent financial data, we'll take a look at whether the stock is fairly priced by estimating the company's future cash flows and discounting them to their present value. One way to achieve this is by employing the Discounted Cash Flow (DCF) model. Believe it or not, it's not too difficult to follow, as you'll see from our example!
We generally believe that a company's value is the present value of all of the cash it will generate in the future. However, a DCF is just one valuation metric among many, and it is not without flaws. If you still have some burning questions about this type of valuation, take a look at the Simply Wall St analysis model.
What's The Estimated Valuation?
We are going to use a two-stage DCF model, which, as the name states, takes into account two stages of growth. The first stage is generally a higher growth period which levels off heading towards the terminal value, captured in the second 'steady growth' period. To begin with, we have to get estimates of the next ten years of cash flows. Where possible we use analyst estimates, but when these aren't available we extrapolate the previous free cash flow (FCF) from the last estimate or reported value. We assume companies with shrinking free cash flow will slow their rate of shrinkage, and that companies with growing free cash flow will see their growth rate slow, over this period. We do this to reflect that growth tends to slow more in the early years than it does in later years.
Generally we assume that a dollar today is more valuable than a dollar in the future, so we need to discount the sum of these future cash flows to arrive at a present value estimate:
10-year free cash flow (FCF) forecast
2024
2025
2026
2027
2028
2029
2030
2031
2032
2033
Levered FCF ($, Millions)
US$2.06b
US$2.61b
US$2.67b
US$2.93b
US$3.09b
US$3.23b
US$3.35b
US$3.46b
US$3.56b
US$3.66b
Growth Rate Estimate Source
Analyst x8
Analyst x7
Analyst x5
Analyst x1
Analyst x1
Est @ 4.30%
Est @ 3.73%
Est @ 3.32%
Est @ 3.04%
Est @ 2.84%
Present Value ($, Millions) Discounted @ 7.4%
US$1.9k
US$2.3k
US$2.2k
US$2.2k
US$2.2k
US$2.1k
US$2.0k
US$2.0k
US$1.9k
US$1.8k
("Est" = FCF growth rate estimated by Simply Wall St) Present Value of 10-year Cash Flow (PVCF) = US$20b
The second stage is also known as Terminal Value, this is the business's cash flow after the first stage. For a number of reasons a very conservative growth rate is used that cannot exceed that of a country's GDP growth. In this case we have used the 5-year average of the 10-year government bond yield (2.4%) to estimate future growth. In the same way as with the 10-year 'growth' period, we discount future cash flows to today's value, using a cost of equity of 7.4%.
Present Value of Terminal Value (PVTV)= TV / (1 + r)10= US$75b÷ ( 1 + 7.4%)10= US$37b
The total value is the sum of cash flows for the next ten years plus the discounted terminal value, which results in the Total Equity Value, which in this case is US$57b. To get the intrinsic value per share, we divide this by the total number of shares outstanding. Compared to the current share price of US$1.1k, the company appears around fair value at the time of writing. Valuations are imprecise instruments though, rather like a telescope - move a few degrees and end up in a different galaxy. Do keep this in mind.
NasdaqGS:ORLY Discounted Cash Flow June 26th 2024
The Assumptions
The calculation above is very dependent on two assumptions. The first is the discount rate and the other is the cash flows. You don't have to agree with these inputs, I recommend redoing the calculations yourself and playing with them. The DCF also does not consider the possible cyclicality of an industry, or a company's future capital requirements, so it does not give a full picture of a company's potential performance. Given that we are looking at O'Reilly Automotive as potential shareholders, the cost of equity is used as the discount rate, rather than the cost of capital (or weighted average cost of capital, WACC) which accounts for debt. In this calculation we've used 7.4%, which is based on a levered beta of 1.090. Beta is a measure of a stock's volatility, compared to the market as a whole. We get our beta from the industry average beta of globally comparable companies, with an imposed limit between 0.8 and 2.0, which is a reasonable range for a stable business.
SWOT Analysis for O'Reilly Automotive
Strength
Earnings growth over the past year exceeded the industry.
Debt is well covered by earnings and cashflows.
Balance sheet summary for ORLY.
Weakness
Earnings growth over the past year is below its 5-year average.
Expensive based on P/E ratio and estimated fair value.
Opportunity
Annual earnings are forecast to grow for the next 3 years.
Threat
Total liabilities exceed total assets, which raises the risk of financial distress.
Annual earnings are forecast to grow slower than the American market.
Is ORLY well equipped to handle threats?
Moving On:
Whilst important, the DCF calculation ideally won't be the sole piece of analysis you scrutinize for a company. It's not possible to obtain a foolproof valuation with a DCF model. Preferably you'd apply different cases and assumptions and see how they would impact the company's valuation. For instance, if the terminal value growth rate is adjusted slightly, it can dramatically alter the overall result. For O'Reilly Automotive, there are three pertinent elements you should consider:
Risks: You should be aware of the 3 warning signs for O'Reilly Automotive (1 makes us a bit uncomfortable!) we've uncovered before considering an investment in the company.
Future Earnings: How does ORLY's growth rate compare to its peers and the wider market? Dig deeper into the analyst consensus number for the upcoming years by interacting with our free analyst growth expectation chart.
Other High Quality Alternatives: Do you like a good all-rounder? Explore our interactive list of high quality stocks to get an idea of what else is out there you may be missing!
PS. Simply Wall St updates its DCF calculation for every American stock every day, so if you want to find the intrinsic value of any other stock just search here.
Have feedback on this article? Concerned about the content?Get in touch with us directly. Alternatively, email editorial-team (at) simplywallst.com. This article by Simply Wall St is general in nature. We provide commentary based on historical data and analyst forecasts only using an unbiased methodology and our articles are not intended to be financial advice. It does not constitute a recommendation to buy or sell any stock, and does not take account of your objectives, or your financial situation. We aim to bring you long-term focused analysis driven by fundamental data. Note that our analysis may not factor in the latest price-sensitive company announcements or qualitative material. Simply Wall St has no position in any stocks mentioned.
Have feedback on this article? Concerned about the content? Get in touch with us directly. Alternatively, email editorial-team@simplywallst.com