
Unum Group's (NYSE:UNM) 26% CAGR Outpaced the Company's Earnings Growth Over the Same Three-year Period
Unum Group's (NYSE:UNM) 26% CAGR Outpaced the Company's Earnings Growth Over the Same Three-year Period
By buying an index fund, you can roughly match the market return with ease. But if you buy good businesses at attractive prices, your portfolio returns could exceed the average market return. For example, the Unum Group (NYSE:UNM) share price is up 79% in the last three years, clearly besting the market return of around 14% (not including dividends). However, more recent returns haven't been as impressive as that, with the stock returning just 13% in the last year, including dividends.
購買指數基金可以輕鬆匹配市場回報。但是如果您以有吸引力的價格購買優秀的企業,您的投資組合回報可能會超過平均市場回報。例如,紐交所(NYSE:UNM)的股價在過去三年中上漲了79%,明顯優於大約14%(不包括分紅)的市場回報。但是,最近的回報並不像那樣令人印象深刻,股票最近一年的回報率僅爲13%,包括分紅。
The past week has proven to be lucrative for Unum Group investors, so let's see if fundamentals drove the company's three-year performance.
過去一週對於尤納姆集團的投資者來說證明是有利可圖的,因此讓我們看看基本面是否推動了該公司的三年表現。
There is no denying that markets are sometimes efficient, but prices do not always reflect underlying business performance. One way to examine how market sentiment has changed over time is to look at the interaction between a company's share price and its earnings per share (EPS).
市場有時無疑是高效的,但價格並不總是反映基礎業務表現。 一種檢查市場情緒如何隨時間改變的方法是查看公司的股價與每股收益(EPS)之間的互動。
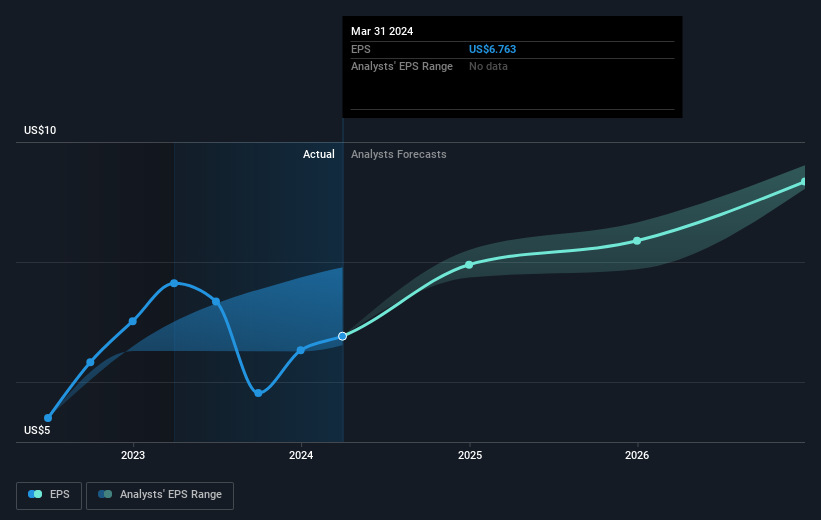
During three years of share price growth, Unum Group achieved compound earnings per share growth of 22% per year. Notably, the 22% average annual share price gain matches up nicely with the EPS growth rate. This suggests that sentiment and expectations have not changed drastically. Quite to the contrary, the share price has arguably reflected the EPS growth.
在股價增長的三年中,尤納姆集團的每股收益複合增長率達到了22%。值得注意的是,22%的年均股價增長率與每股收益增長率非常相似。這表明情緒和預期並沒有發生很大變化。相反,股價可能反映了每股收益的增長。
The company's earnings per share (over time) is depicted in the image below (click to see the exact numbers).
該公司的每股收益(隨時間的推移)如下圖所示(單擊可查看確切數字)。
Dive deeper into Unum Group's key metrics by checking this interactive graph of Unum Group's earnings, revenue and cash flow.
通過查看尤納姆集團盈利、營業收入和現金流的交互式圖表,深入了解尤納姆集團的關鍵指標。
What About Dividends?
那麼分紅怎麼樣呢?
When looking at investment returns, it is important to consider the difference between total shareholder return (TSR) and share price return. Whereas the share price return only reflects the change in the share price, the TSR includes the value of dividends (assuming they were reinvested) and the benefit of any discounted capital raising or spin-off. It's fair to say that the TSR gives a more complete picture for stocks that pay a dividend. In the case of Unum Group, it has a TSR of 100% for the last 3 years. That exceeds its share price return that we previously mentioned. The dividends paid by the company have thusly boosted the total shareholder return.
在考慮投資回報時,重要的是考慮總股東回報(TSR)和股票回報之間的差異。 TSR包括任何剝離或折讓的資本籌集(基於股息被重新投資的假設),以及任何股息。因此,對於支付慷慨的股息公司而言,TSR通常比股票回報高得多。就中國神威藥業集團而言,其TSR在過去5年中達到了75%。這超過了我們之前提到的股票回報。該公司支付的股息已經提高了總股東回報。總股東回報和股票回報而股價回報僅反映股價的變動,TSR包括分紅的價值(假設分紅已再投資)和任何折價資本籌集或剝離的利益。可以說,TSR爲支付股息的股票提供了更完整的圖片。在尤納姆集團的情況下,過去3年其TSR爲100%。這超過了我們以前提到的股價回報。公司支付的股息已經提高了。總股東回報。
A Different Perspective
不同的觀點
Unum Group provided a TSR of 13% over the last twelve months. But that return falls short of the market. On the bright side, that's still a gain, and it's actually better than the average return of 13% over half a decade It is possible that returns will improve along with the business fundamentals. While it is well worth considering the different impacts that market conditions can have on the share price, there are other factors that are even more important. To that end, you should be aware of the 1 warning sign we've spotted with Unum Group .
尤納姆集團提供了過去12個月的13%的TSR。但這一回報不及市場。好消息是,這仍然是一個收益,並且實際上比半個十年的平均收益13%更好。隨着業務基本面的改善,回報有可能會提高。雖然考慮市場狀況可能對股價產生的不同影響非常值得,但還有其他更重要的因素。爲此,您應該知道我們發現的1個警告信號。
If you like to buy stocks alongside management, then you might just love this free list of companies. (Hint: many of them are unnoticed AND have attractive valuation).
如果您喜歡與管理層一起購買股票,那麼您可能會喜歡這個公司的免費列表。 (提示:其中許多公司不爲人注意且具有吸引力的估值。)
Please note, the market returns quoted in this article reflect the market weighted average returns of stocks that currently trade on American exchanges.
請注意,本文所引述的市場回報反映了目前在美國交易所上市的股票的市場加權平均回報。
Have feedback on this article? Concerned about the content? Get in touch with us directly. Alternatively, email editorial-team (at) simplywallst.com.
This article by Simply Wall St is general in nature. We provide commentary based on historical data and analyst forecasts only using an unbiased methodology and our articles are not intended to be financial advice. It does not constitute a recommendation to buy or sell any stock, and does not take account of your objectives, or your financial situation. We aim to bring you long-term focused analysis driven by fundamental data. Note that our analysis may not factor in the latest price-sensitive company announcements or qualitative material. Simply Wall St has no position in any stocks mentioned.
對本文有反饋?關於內容有所顧慮?直接和我們聯繫。或者,發送電子郵件至editorial-team (at) simplywallst.com。
這篇文章是Simply Wall St的一般性文章。我們根據歷史數據和分析師預測提供評論,只使用公正的方法論,我們的文章並不意味着提供任何金融建議。文章不構成買賣任何股票的建議,也不考慮您的目標或您的財務狀況。我們的目標是帶給您基本數據驅動的長期關注分析。請注意,我們的分析可能不考慮最新的價格敏感公司公告或定性材料。Simply Wall St沒有任何股票頭寸。
Have feedback on this article? Concerned about the content? Get in touch with us directly. Alternatively, email editorial-team@simplywallst.com
對本文有反饋?關於內容有所顧慮?直接和我們聯繫。或者發送電子郵件至editorial-team@simplywallst.com。
譯文內容由第三人軟體翻譯。