
Kiniksa Pharmaceuticals (NASDAQ:KNSA) Pulls Back 3.9% This Week, but Still Delivers Shareholders Decent 6.4% CAGR Over 5 Years
Kiniksa Pharmaceuticals (NASDAQ:KNSA) Pulls Back 3.9% This Week, but Still Delivers Shareholders Decent 6.4% CAGR Over 5 Years
The main point of investing for the long term is to make money. Better yet, you'd like to see the share price move up more than the market average. But Kiniksa Pharmaceuticals, Ltd. (NASDAQ:KNSA) has fallen short of that second goal, with a share price rise of 37% over five years, which is below the market return. Zooming in, the stock is up a respectable 12% in the last year.
長期投資的主要目的是賺錢。更好的是,您希望看到股價上漲超過市場平均水平。但是Kiniksa製藥股份有限公司(納斯達克:KNSA)未能達到第二個目標,五年股價上漲37%,低於市場回報。具體來說,該股票在過去一年中上漲了12%。
In light of the stock dropping 3.9% in the past week, we want to investigate the longer term story, and see if fundamentals have been the driver of the company's positive five-year return.
考慮到該股票在過去一週下跌了3.9%,我們想調查更長期的情況,並查看公司正面的五年回報是否基於基本面因素。
While Kiniksa Pharmaceuticals made a small profit, in the last year, we think that the market is probably more focussed on the top line growth at the moment. Generally speaking, we'd consider a stock like this alongside loss-making companies, simply because the quantum of the profit is so low. It would be hard to believe in a more profitable future without growing revenues.
雖然Kiniksa製藥在過去一年依然獲得了小額利潤,但我們認爲目前市場可能更關注營收增長。一般來說,我們認爲這種股票與虧損的公司一起考慮,只是因爲利潤太低了。在沒有增長的營收的情況下,很難相信未來會更賺錢。
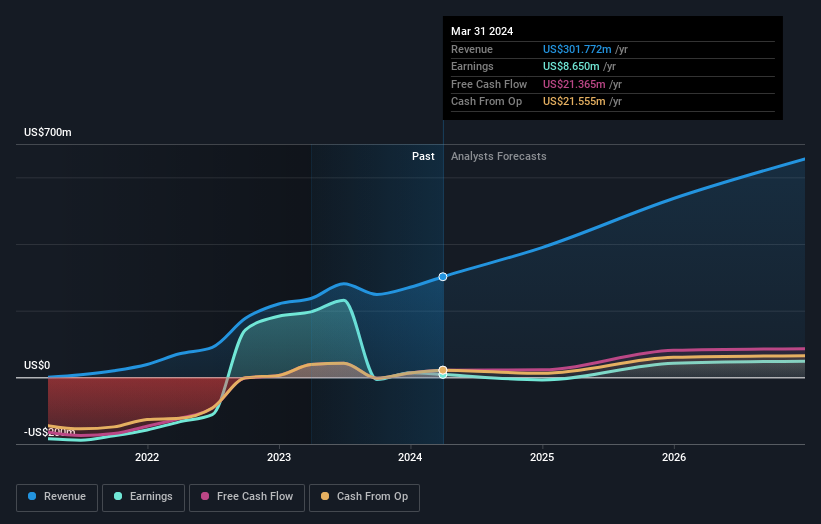
In the last 5 years Kiniksa Pharmaceuticals saw its revenue grow at 73% per year. That's well above most pre-profit companies. It's nice to see shareholders have made a profit, but the gain of 6% over the period isn't that impressive compared to the overall market. You could argue the market is still pretty skeptical, given the growing revenues. Arguably this falls in a potential sweet spot - modest share price gains but good top line growth over the long term justifies investigation, in our book.
在過去5年中,Kiniksa製藥的收入年均增長73%。這遠高於大多數未實現盈利的公司。股東獲得了利潤,這很不錯,但在該時期內獲得的6%的收益與整體市場相比並不那麼令人印象深刻。可以認爲市場仍然非常懷疑,考慮到不斷增長的營收,這可能屬於潛在的甜點。長期來看,股票價格略有增長,但良好的收入增長趨勢值得進一步研究。
You can see below how earnings and revenue have changed over time (discover the exact values by clicking on the image).
您可以看到以下收益和營收的變化情況(通過單擊圖像了解精確值)。
It is of course excellent to see how Kiniksa Pharmaceuticals has grown profits over the years, but the future is more important for shareholders. You can see how its balance sheet has strengthened (or weakened) over time in this free interactive graphic.
當然,看到Kiniksa製藥多年來盈利增長是非常好的,但未來對股東更爲重要。您可以通過此免費交互式圖形,了解該公司的資產負債表如何隨着時間的推移而變得更加堅實(或變弱)。
A Different Perspective
不同的觀點
Kiniksa Pharmaceuticals shareholders gained a total return of 12% during the year. Unfortunately this falls short of the market return. The silver lining is that the gain was actually better than the average annual return of 6% per year over five year. It is possible that returns will improve along with the business fundamentals. It's always interesting to track share price performance over the longer term. But to understand Kiniksa Pharmaceuticals better, we need to consider many other factors. Consider for instance, the ever-present spectre of investment risk. We've identified 1 warning sign with Kiniksa Pharmaceuticals , and understanding them should be part of your investment process.
Kiniksa製藥股東在該年中獲得了總回報率達12%。不幸的是,這低於市場回報。好消息是,該增長實際上比過去5年平均年回報率6%更爲突出。隨着業務基本面的提高,回報可能會改善。長期來看,追蹤股票價格表現總是很有趣的。但是,爲了更好地了解Kiniksa製藥,我們需要考慮許多其他因素。例如,不斷存在的投資風險。我們已經確認Kiniksa製藥存在1個警告信號,理解它們應該是您的投資過程的一部分。
If you are like me, then you will not want to miss this free list of undervalued small caps that insiders are buying.
如果您像我一樣,就不會希望錯過這份免費的內部人士正在購買的低估小市值股票列表。
Please note, the market returns quoted in this article reflect the market weighted average returns of stocks that currently trade on American exchanges.
請注意,本文所引述的市場回報反映了目前在美國交易所上市的股票的市場加權平均回報。
Have feedback on this article? Concerned about the content? Get in touch with us directly. Alternatively, email editorial-team (at) simplywallst.com.
This article by Simply Wall St is general in nature. We provide commentary based on historical data and analyst forecasts only using an unbiased methodology and our articles are not intended to be financial advice. It does not constitute a recommendation to buy or sell any stock, and does not take account of your objectives, or your financial situation. We aim to bring you long-term focused analysis driven by fundamental data. Note that our analysis may not factor in the latest price-sensitive company announcements or qualitative material. Simply Wall St has no position in any stocks mentioned.
對本文有反饋?關於內容有所顧慮?直接和我們聯繫。或者,發送電子郵件至editorial-team (at) simplywallst.com。
這篇文章是Simply Wall St的一般性文章。我們根據歷史數據和分析師預測提供評論,只使用公正的方法論,我們的文章並不意味着提供任何金融建議。文章不構成買賣任何股票的建議,也不考慮您的目標或您的財務狀況。我們的目標是帶給您基本數據驅動的長期關注分析。請注意,我們的分析可能不考慮最新的價格敏感公司公告或定性材料。Simply Wall St沒有任何股票頭寸。
Have feedback on this article? Concerned about the content? Get in touch with us directly. Alternatively, email editorial-team@simplywallst.com
對本文有反饋?關於內容有所顧慮?直接和我們聯繫。或者發送電子郵件至editorial-team@simplywallst.com。
譯文內容由第三人軟體翻譯。