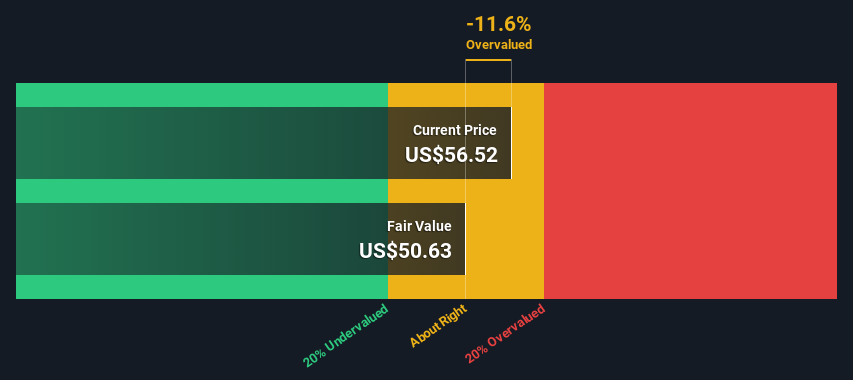
Rambus' estimated fair value is US$50.63 based on 2 Stage Free Cash Flow to Equity
Current share price of US$56.52 suggests Rambus is potentially trading close to its fair value
The US$76.20 analyst price target for RMBS is 50% more than our estimate of fair value
Today we'll do a simple run through of a valuation method used to estimate the attractiveness of Rambus Inc. (NASDAQ:RMBS) as an investment opportunity by taking the expected future cash flows and discounting them to their present value. One way to achieve this is by employing the Discounted Cash Flow (DCF) model. Before you think you won't be able to understand it, just read on! It's actually much less complex than you'd imagine.
Remember though, that there are many ways to estimate a company's value, and a DCF is just one method. Anyone interested in learning a bit more about intrinsic value should have a read of the Simply Wall St analysis model.
What's The Estimated Valuation?
We use what is known as a 2-stage model, which simply means we have two different periods of growth rates for the company's cash flows. Generally the first stage is higher growth, and the second stage is a lower growth phase. In the first stage we need to estimate the cash flows to the business over the next ten years. Where possible we use analyst estimates, but when these aren't available we extrapolate the previous free cash flow (FCF) from the last estimate or reported value. We assume companies with shrinking free cash flow will slow their rate of shrinkage, and that companies with growing free cash flow will see their growth rate slow, over this period. We do this to reflect that growth tends to slow more in the early years than it does in later years.
A DCF is all about the idea that a dollar in the future is less valuable than a dollar today, so we discount the value of these future cash flows to their estimated value in today's dollars:
10-year free cash flow (FCF) forecast
2024
2025
2026
2027
2028
2029
2030
2031
2032
2033
Levered FCF ($, Millions)
US$174.1m
US$219.0m
US$276.6m
US$314.1m
US$346.1m
US$373.3m
US$396.5m
US$416.5m
US$434.3m
US$450.3m
Growth Rate Estimate Source
Analyst x2
Analyst x2
Analyst x1
Est @ 13.55%
Est @ 10.20%
Est @ 7.85%
Est @ 6.21%
Est @ 5.06%
Est @ 4.26%
Est @ 3.69%
Present Value ($, Millions) Discounted @ 8.5%
US$160
US$186
US$217
US$227
US$230
US$229
US$224
US$217
US$209
US$200
("Est" = FCF growth rate estimated by Simply Wall St) Present Value of 10-year Cash Flow (PVCF) = US$2.1b
The second stage is also known as Terminal Value, this is the business's cash flow after the first stage. The Gordon Growth formula is used to calculate Terminal Value at a future annual growth rate equal to the 5-year average of the 10-year government bond yield of 2.4%. We discount the terminal cash flows to today's value at a cost of equity of 8.5%.
Present Value of Terminal Value (PVTV)= TV / (1 + r)10= US$7.6b÷ ( 1 + 8.5%)10= US$3.4b
The total value, or equity value, is then the sum of the present value of the future cash flows, which in this case is US$5.5b. In the final step we divide the equity value by the number of shares outstanding. Compared to the current share price of US$56.5, the company appears around fair value at the time of writing. Valuations are imprecise instruments though, rather like a telescope - move a few degrees and end up in a different galaxy. Do keep this in mind.
NasdaqGS:RMBS Discounted Cash Flow June 18th 2024
Important Assumptions
The calculation above is very dependent on two assumptions. The first is the discount rate and the other is the cash flows. If you don't agree with these result, have a go at the calculation yourself and play with the assumptions. The DCF also does not consider the possible cyclicality of an industry, or a company's future capital requirements, so it does not give a full picture of a company's potential performance. Given that we are looking at Rambus as potential shareholders, the cost of equity is used as the discount rate, rather than the cost of capital (or weighted average cost of capital, WACC) which accounts for debt. In this calculation we've used 8.5%, which is based on a levered beta of 1.324. Beta is a measure of a stock's volatility, compared to the market as a whole. We get our beta from the industry average beta of globally comparable companies, with an imposed limit between 0.8 and 2.0, which is a reasonable range for a stable business.
SWOT Analysis for Rambus
Strength
Earnings growth over the past year exceeded the industry.
Currently debt free.
Balance sheet summary for RMBS.
Weakness
No major weaknesses identified for RMBS.
Opportunity
Annual revenue is forecast to grow faster than the American market.
Good value based on P/E ratio compared to estimated Fair P/E ratio.
Threat
Annual earnings are forecast to decline for the next 3 years.
What else are analysts forecasting for RMBS?
Moving On:
Whilst important, the DCF calculation shouldn't be the only metric you look at when researching a company. It's not possible to obtain a foolproof valuation with a DCF model. Instead the best use for a DCF model is to test certain assumptions and theories to see if they would lead to the company being undervalued or overvalued. If a company grows at a different rate, or if its cost of equity or risk free rate changes sharply, the output can look very different. For Rambus, there are three further elements you should assess:
Risks: Take risks, for example - Rambus has 3 warning signs (and 2 which don't sit too well with us) we think you should know about.
Future Earnings: How does RMBS's growth rate compare to its peers and the wider market? Dig deeper into the analyst consensus number for the upcoming years by interacting with our free analyst growth expectation chart.
Other Solid Businesses: Low debt, high returns on equity and good past performance are fundamental to a strong business. Why not explore our interactive list of stocks with solid business fundamentals to see if there are other companies you may not have considered!
PS. The Simply Wall St app conducts a discounted cash flow valuation for every stock on the NASDAQGS every day. If you want to find the calculation for other stocks just search here.
Have feedback on this article? Concerned about the content?Get in touch with us directly. Alternatively, email editorial-team (at) simplywallst.com. This article by Simply Wall St is general in nature. We provide commentary based on historical data and analyst forecasts only using an unbiased methodology and our articles are not intended to be financial advice. It does not constitute a recommendation to buy or sell any stock, and does not take account of your objectives, or your financial situation. We aim to bring you long-term focused analysis driven by fundamental data. Note that our analysis may not factor in the latest price-sensitive company announcements or qualitative material. Simply Wall St has no position in any stocks mentioned.
Have feedback on this article? Concerned about the content? Get in touch with us directly. Alternatively, email editorial-team@simplywallst.com
主要見解
根據 2 階段自由現金流估值法,Rambus 的估值爲 50.63 美元。
目前的股價爲 56.52 美元,意味着 Rambus 可能接近其公允價值。
RMBS 的分析師目標價爲 76.20 美元,比我們的公平價值估計值高 50%。
今天我們將逐步介紹一種估值方法,通過將預期未來現金流折現到現值來評估 Rambus Inc. (NASDAQ: RMBS) 的吸引力作爲一項投資機會。其中一種實現這一目的的方法是採用貼現現金流量 (DCF) 模型。在你認爲自己無法理解它之前,請繼續閱讀!實際上它比你想象的要簡單得多。