
Transcat's (NASDAQ:TRNS) Earnings Growth Rate Lags the 37% CAGR Delivered to Shareholders
Transcat's (NASDAQ:TRNS) Earnings Growth Rate Lags the 37% CAGR Delivered to Shareholders
Long term investing can be life changing when you buy and hold the truly great businesses. While not every stock performs well, when investors win, they can win big. To wit, the Transcat, Inc. (NASDAQ:TRNS) share price has soared 377% over five years. And this is just one example of the epic gains achieved by some long term investors. Unfortunately, though, the stock has dropped 4.6% over a week.
當你購買和持有真正優秀的企業時,長期投資可以改變生活。雖然並非每隻股票都表現良好,但當投資者贏得時,他們會贏得很大。拿納斯達克:TRNS爲例,股價在五年內飆升了377%。這隻股票的表現是一些長期投資者所取得的史詩般的利潤之一。然而,不幸的是,該股票在一週內下跌了4.6%。
While the stock has fallen 4.6% this week, it's worth focusing on the longer term and seeing if the stocks historical returns have been driven by the underlying fundamentals.
雖然股票本週下跌了4.6%,但值得關注的是它的長期表現,以確定股票的歷史回報是否由基本面驅動。
While the efficient markets hypothesis continues to be taught by some, it has been proven that markets are over-reactive dynamic systems, and investors are not always rational. One way to examine how market sentiment has changed over time is to look at the interaction between a company's share price and its earnings per share (EPS).
雖然有效市場假說仍然被一些人教授,但被證明市場是過度反應的動態系統,投資者並不總是理性的。檢查市場情緒如何隨時間變化的一種方法是看一個公司的股價與其每股收益(EPS)之間的交互作用。
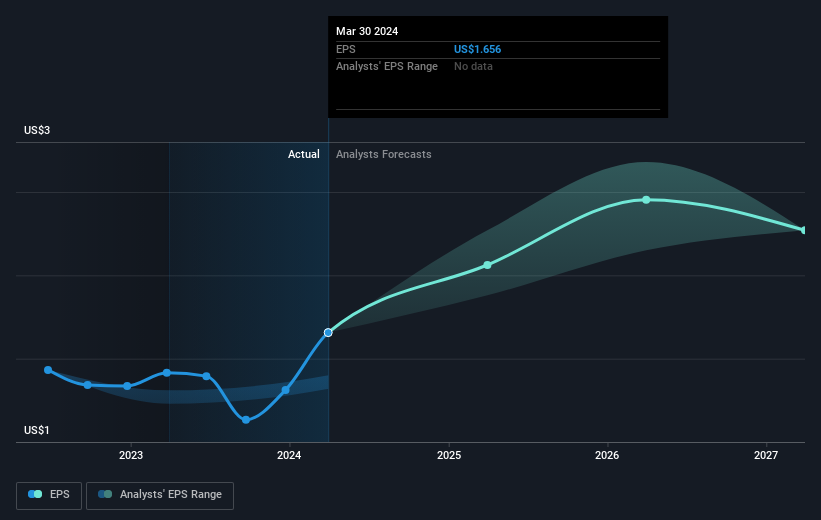
Over half a decade, Transcat managed to grow its earnings per share at 8.5% a year. This EPS growth is lower than the 37% average annual increase in the share price. So it's fair to assume the market has a higher opinion of the business than it did five years ago. And that's hardly shocking given the track record of growth. This favorable sentiment is reflected in its (fairly optimistic) P/E ratio of 81.38.
在五年的時間裏,Transcat成功地將每股收益增長率穩定保持在8.5%的年增長率。這種每股收益增長率低於37%的股價年均增長率。因此可以合理地認爲市場對該企業的評價比五年前更高。這種良好的情緒體現在其(相當樂觀的)市盈率爲81.38。
The image below shows how EPS has tracked over time (if you click on the image you can see greater detail).
下圖顯示了EPS隨時間的變化情況(如果您單擊該圖像,則可以查看更多詳細信息)。
We consider it positive that insiders have made significant purchases in the last year. Having said that, most people consider earnings and revenue growth trends to be a more meaningful guide to the business. Dive deeper into the earnings by checking this interactive graph of Transcat's earnings, revenue and cash flow.
我們認爲內部人員在過去一年中進行了重大購買是積極的。儘管如此,大多數人認爲,收益和營收增長趨勢對企業的影響更有意義。通過查看Transcat收益,營收和現金流的互動圖表來深入挖掘收益。
A Different Perspective
不同的觀點
It's nice to see that Transcat shareholders have received a total shareholder return of 37% over the last year. Since the one-year TSR is better than the five-year TSR (the latter coming in at 37% per year), it would seem that the stock's performance has improved in recent times. In the best case scenario, this may hint at some real business momentum, implying that now could be a great time to delve deeper. I find it very interesting to look at share price over the long term as a proxy for business performance. But to truly gain insight, we need to consider other information, too. Consider risks, for instance. Every company has them, and we've spotted 2 warning signs for Transcat you should know about.
很高興看到Transcat股東在過去一年中獲得了總股東回報率爲37%。由於一年的股東總回報率優於五年的股東總回報率(後者爲每年37%),因此股票表現在最近改善是肯定的。在最好的情況下,這可能暗示着一些真正的業務動力,這意味着現在可能是深入挖掘的絕佳時機。我發現用股價作爲業務績效的代理來觀察長期表現非常有趣。但是爲了真正獲得洞察力,我們還需要考慮其他信息。例如,考慮風險。每個公司都有它們的風險,並且我們已經發現Transcat的2個警告標誌,你應該知道。
There are plenty of other companies that have insiders buying up shares. You probably do not want to miss this free list of undervalued small cap companies that insiders are buying.
還有很多其他的公司,公司的內部人士正在購買股票。你可能不想錯過這個免費的小市值公司的低估列表。
Please note, the market returns quoted in this article reflect the market weighted average returns of stocks that currently trade on American exchanges.
請注意,本文所引述的市場回報反映了目前在美國交易所上市的股票的市場加權平均回報。
Have feedback on this article? Concerned about the content? Get in touch with us directly. Alternatively, email editorial-team (at) simplywallst.com.
This article by Simply Wall St is general in nature. We provide commentary based on historical data and analyst forecasts only using an unbiased methodology and our articles are not intended to be financial advice. It does not constitute a recommendation to buy or sell any stock, and does not take account of your objectives, or your financial situation. We aim to bring you long-term focused analysis driven by fundamental data. Note that our analysis may not factor in the latest price-sensitive company announcements or qualitative material. Simply Wall St has no position in any stocks mentioned.
對本文有反饋?關於內容有所顧慮?直接和我們聯繫。或者,發送電子郵件至editorial-team (at) simplywallst.com。
這篇文章是Simply Wall St的一般性文章。我們根據歷史數據和分析師預測提供評論,只使用公正的方法論,我們的文章並不意味着提供任何金融建議。文章不構成買賣任何股票的建議,也不考慮您的目標或您的財務狀況。我們的目標是帶給您基本數據驅動的長期關注分析。請注意,我們的分析可能不考慮最新的價格敏感公司公告或定性材料。Simply Wall St沒有任何股票頭寸。
Have feedback on this article? Concerned about the content? Get in touch with us directly. Alternatively, email editorial-team@simplywallst.com
對本文有反饋?關於內容有所顧慮?直接和我們聯繫。或者發送電子郵件至editorial-team@simplywallst.com。
譯文內容由第三人軟體翻譯。