
Here's Why ICON (NASDAQ:ICLR) Can Manage Its Debt Responsibly
Here's Why ICON (NASDAQ:ICLR) Can Manage Its Debt Responsibly
Warren Buffett famously said, 'Volatility is far from synonymous with risk.' When we think about how risky a company is, we always like to look at its use of debt, since debt overload can lead to ruin. As with many other companies ICON Public Limited Company (NASDAQ:ICLR) makes use of debt. But is this debt a concern to shareholders?
禾倫·巴菲特曾經說過,“波動性遠非風險的代名詞”。評估一家公司風險時,我們一般會關注它使用的債務,因爲負債過重可能導致破產。與許多其他公司一樣,ICON Public Limited Company(納斯達克:ICLR)也在使用債務。但這個債務是否會對股東構成威脅呢?
When Is Debt Dangerous?
債務何時有危險?
Debt is a tool to help businesses grow, but if a business is incapable of paying off its lenders, then it exists at their mercy. Part and parcel of capitalism is the process of 'creative destruction' where failed businesses are mercilessly liquidated by their bankers. However, a more common (but still painful) scenario is that it has to raise new equity capital at a low price, thus permanently diluting shareholders. Of course, the upside of debt is that it often represents cheap capital, especially when it replaces dilution in a company with the ability to reinvest at high rates of return. The first step when considering a company's debt levels is to consider its cash and debt together.
債務是幫助企業增長的工具,但如果企業無法償還債務,那麼它就處在債權人的控制之下。資本主義的必要環節是“創造性破壞”,即債權人無情地清算債務違約的企業。然而,更常見(但仍然痛苦的)情況是,企業不得不以低價發行新股份,從而永久性地稀釋股東權益。當然,債務的好處在於它往往代表了廉價的資本,尤其是在替換具有高回報率的再投資能力的公司的稀釋時。考慮一家公司的債務水平時,第一步是考慮其現金和債務的總和。
What Is ICON's Debt?
ICON的債務是多少?
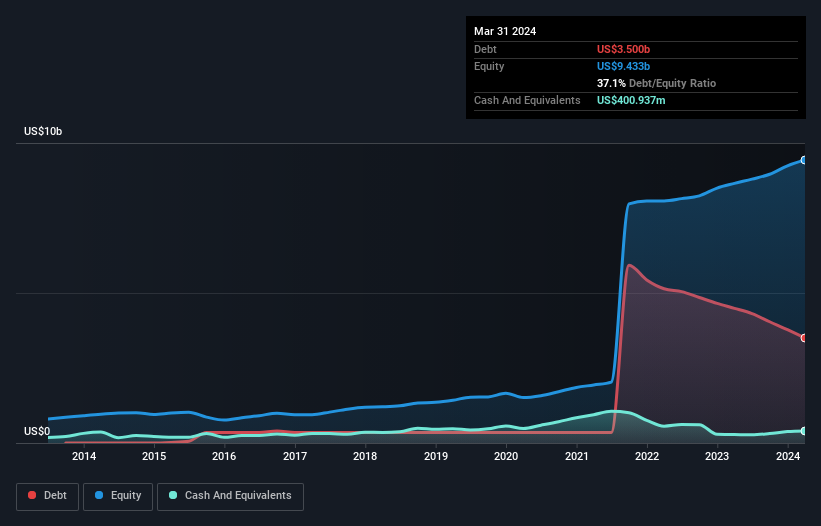
As you can see below, ICON had US$3.50b of debt at March 2024, down from US$4.49b a year prior. However, it does have US$400.9m in cash offsetting this, leading to net debt of about US$3.10b.
如下所示,截至2024年3月,ICON的債務總額爲35億美元,低於一年前的44.9億美元。然而,它有4.009億美元的現金可抵消這筆債務,因此淨債務約爲31億美元。
A Look At ICON's Liabilities
ICON的負債情況
The latest balance sheet data shows that ICON had liabilities of US$2.95b due within a year, and liabilities of US$4.67b falling due after that. Offsetting this, it had US$400.9m in cash and US$3.00b in receivables that were due within 12 months. So its liabilities outweigh the sum of its cash and (near-term) receivables by US$4.21b.
最新的資產負債表數據顯示,ICON一年內到期的負債爲29.5億美元,28.4億美元的負債到期後到期。然而,它擁有4.009億美元的現金和3億美元的應收賬款,這些應收賬款在12個月內到期。因此,其負債超過其現金和(近期)應收賬款的總和約爲42.1億美元。
Given ICON has a humongous market capitalization of US$26.2b, it's hard to believe these liabilities pose much threat. Having said that, it's clear that we should continue to monitor its balance sheet, lest it change for the worse.
考慮到ICON的巨大市值爲262億美元,很難相信這些負債對其構成了太大的威脅。話雖如此,顯然我們應該繼續監測它的資產負債表,以防不測。
We use two main ratios to inform us about debt levels relative to earnings. The first is net debt divided by earnings before interest, tax, depreciation, and amortization (EBITDA), while the second is how many times its earnings before interest and tax (EBIT) covers its interest expense (or its interest cover, for short). The advantage of this approach is that we take into account both the absolute quantum of debt (with net debt to EBITDA) and the actual interest expenses associated with that debt (with its interest cover ratio).
我們使用兩個主要比率來分析債務與收益之間的關係。第一個比率是淨債務與利息、稅、折舊和攤銷前利潤(EBITDA)的比率,第二個比率是其利潤前利潤和稅(EBIT)覆蓋利息支出的次數(或其利息覆蓋比率)。這種方法的優點在於我們考慮到了債務的絕對數量(通過淨債務與EBITDA的比率),以及與這些債務相關的實際利息支出(通過其利息覆蓋比率)。
ICON has net debt worth 1.8 times EBITDA, which isn't too much, but its interest cover looks a bit on the low side, with EBIT at only 3.5 times the interest expense. While these numbers do not alarm us, it's worth noting that the cost of the company's debt is having a real impact. If ICON can keep growing EBIT at last year's rate of 20% over the last year, then it will find its debt load easier to manage. When analysing debt levels, the balance sheet is the obvious place to start. But ultimately the future profitability of the business will decide if ICON can strengthen its balance sheet over time. So if you want to see what the professionals think, you might find this free report on analyst profit forecasts to be interesting.
ICON的淨債務價值爲1.8倍EBITDA,這並不算太多,但它的利息覆蓋率似乎有點偏低,EBIT僅爲利息費用的3.5倍。雖然這些數字並不令我們擔憂,但值得注意的是,公司的債務成本正在產生實際影響。如果ICON能保持去年20%的EBIT增長率,那麼它將更容易管理其債務負擔。分析債務水平時,資產負債表是顯然的起點。但最終,企業未來的盈利能力將決定ICON能否隨着時間的推移加強其資產負債表。所以,如果您想看看專業人士的看法,您可能會覺得這份關於分析師盈利預測的免費報告很有趣。
Finally, a business needs free cash flow to pay off debt; accounting profits just don't cut it. So we always check how much of that EBIT is translated into free cash flow. During the last three years, ICON generated free cash flow amounting to a very robust 91% of its EBIT, more than we'd expect. That positions it well to pay down debt if desirable to do so.
最後,一家企業需要自由現金流來償還債務;會計利潤並不能滿足這一點。因此,我們總是會檢查EBIT的多少被轉換爲自由現金流。在過去的三年中,ICON產生了非常強大的自由現金流,相當於其EBIT的91%,超出了我們的預期。如果需要的話,這將使其更好地償還債務。
Our View
我們的觀點
ICON's conversion of EBIT to free cash flow suggests it can handle its debt as easily as Cristiano Ronaldo could score a goal against an under 14's goalkeeper. But truth be told we feel its interest cover does undermine this impression a bit. When we consider the range of factors above, it looks like ICON is pretty sensible with its use of debt. While that brings some risk, it can also enhance returns for shareholders. Above most other metrics, we think its important to track how fast earnings per share is growing, if at all. If you've also come to that realization, you're in luck, because today you can view this interactive graph of ICON's earnings per share history for free.
ICON的EBIT轉自由現金流表明它可以像Cristiano Ronaldo對付14歲以下的守門員一樣輕鬆處理債務。但說實話,我們覺得它的利息覆蓋率有點削弱了這個印象。考慮到上述一系列因素,我們認爲ICON在使用債務方面比較明智。儘管這帶來了一些風險,但也可以爲股東帶來更大的回報。在許多其他指標之上,我們認爲跟蹤每股收益增長的速度特別重要,如果有的話。如果您也已經認識到這一點,那麼您很幸運,因爲今天您可以免費查看ICON的每股收益歷史的交互式圖表了。
At the end of the day, it's often better to focus on companies that are free from net debt. You can access our special list of such companies (all with a track record of profit growth). It's free.
總的來說,專注於沒有淨債務的公司往往更好。您可以訪問我們的特別列表,其中包含這些公司(所有這些公司都有盈利增長的記錄)。這是免費的。
Have feedback on this article? Concerned about the content? Get in touch with us directly. Alternatively, email editorial-team (at) simplywallst.com.
This article by Simply Wall St is general in nature. We provide commentary based on historical data and analyst forecasts only using an unbiased methodology and our articles are not intended to be financial advice. It does not constitute a recommendation to buy or sell any stock, and does not take account of your objectives, or your financial situation. We aim to bring you long-term focused analysis driven by fundamental data. Note that our analysis may not factor in the latest price-sensitive company announcements or qualitative material. Simply Wall St has no position in any stocks mentioned.
對本文有反饋?關於內容有所顧慮?直接和我們聯繫。或者,發送電子郵件至editorial-team (at) simplywallst.com。
這篇文章是Simply Wall St的一般性文章。我們根據歷史數據和分析師預測提供評論,只使用公正的方法論,我們的文章並不意味着提供任何金融建議。文章不構成買賣任何股票的建議,也不考慮您的目標或您的財務狀況。我們的目標是帶給您基本數據驅動的長期關注分析。請注意,我們的分析可能不考慮最新的價格敏感公司公告或定性材料。Simply Wall St沒有任何股票頭寸。
譯文內容由第三人軟體翻譯。