
Shareholders in Autohome (NYSE:ATHM) Are in the Red If They Invested Five Years Ago
Shareholders in Autohome (NYSE:ATHM) Are in the Red If They Invested Five Years Ago
We think intelligent long term investing is the way to go. But unfortunately, some companies simply don't succeed. Zooming in on an example, the Autohome Inc. (NYSE:ATHM) share price dropped 69% in the last half decade. We certainly feel for shareholders who bought near the top.
我們認爲智能的長期投資是正確的道路,但不幸的是,有些公司並不成功。以汽車之家(臨時代碼)(NYSE:ATHM)的股票價格下跌了69%作爲例子。我們對那些在高位買入的股東感到遺憾。
With that in mind, it's worth seeing if the company's underlying fundamentals have been the driver of long term performance, or if there are some discrepancies.
鑑於此,值得看看該公司的基本面是否一直是長期業績的驅動因素,或者是否存在一些不一致之處。
To quote Buffett, 'Ships will sail around the world but the Flat Earth Society will flourish. There will continue to be wide discrepancies between price and value in the marketplace...' One flawed but reasonable way to assess how sentiment around a company has changed is to compare the earnings per share (EPS) with the share price.
引用巴菲特的話說,“船隻會在世界各地航行,但是持平地球學會會蓬勃發展。在市場上,價格和價值之間將繼續存在巨大的差距……”評估公司周圍情緒變化的一種有缺陷但合理的方法是將每股收益(EPS)與股價進行比較。
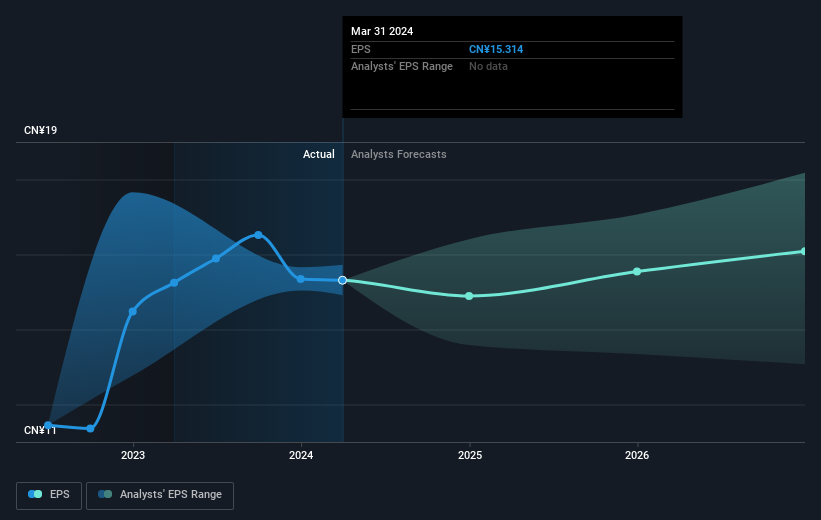
During the five years over which the share price declined, Autohome's earnings per share (EPS) dropped by 9.7% each year. This reduction in EPS is less than the 21% annual reduction in the share price. So it seems the market was too confident about the business, in the past.
在股票價格下跌的五年期間,汽車之家的每股收益(EPS)年均下降9.7%。EPS的降低比股票價格年均下降21%要少。因此,似乎市場在過去對這個公司過於自信。
The graphic below depicts how EPS has changed over time (unveil the exact values by clicking on the image).
下圖顯示了EPS隨時間變化的情況(點擊圖像以顯示確切值)。
Before buying or selling a stock, we always recommend a close examination of historic growth trends, available here.
在購買或出售股票之前,我們始終建議仔細研究歷史增長趨勢,此處提供。
What About Dividends?
那麼分紅怎麼樣呢?
As well as measuring the share price return, investors should also consider the total shareholder return (TSR). The TSR is a return calculation that accounts for the value of cash dividends (assuming that any dividend received was reinvested) and the calculated value of any discounted capital raisings and spin-offs. Arguably, the TSR gives a more comprehensive picture of the return generated by a stock. We note that for Autohome the TSR over the last 5 years was -66%, which is better than the share price return mentioned above. And there's no prize for guessing that the dividend payments largely explain the divergence!
除了衡量股票價格回報,投資者也應考慮總股東回報(TSR)。TSR是一種回報計算,考慮到現金股利的價值(假設收到的任何股利都是再投資)和任何折價資本募集和剝離的計算價值。可以說,TSR更全面地反映了股票的回報。我們注意到,在過去的5年中,汽車之家的TSR爲-66%,比上述股票價格回報要好。而且,毫無疑問,分紅派息很大程度上解釋了這種分化!
A Different Perspective
不同的觀點
While the broader market gained around 23% in the last year, Autohome shareholders lost 4.6% (even including dividends). Even the share prices of good stocks drop sometimes, but we want to see improvements in the fundamental metrics of a business, before getting too interested. Unfortunately, longer term shareholders are suffering worse, given the loss of 11% doled out over the last five years. We would want clear information suggesting the company will grow, before taking the view that the share price will stabilize. I find it very interesting to look at share price over the long term as a proxy for business performance. But to truly gain insight, we need to consider other information, too. Take risks, for example - Autohome has 1 warning sign we think you should be aware of.
雖然整個市場在去年上漲了約23%,但汽車之家的股東卻損失了4.6%(包括股息)。即使好的股票價格有時也會下跌,但在我們產生濃厚興趣之前,我們希望看到企業基本指標的改善。不幸的是,長期股東們的損失更大,過去5年的跌幅達到了11%。在我們認爲股票價格將穩定之前,我們需要清楚的信息表明公司將會增長。我發現長期觀察股票價格作爲業務表現的一種代理非常有趣。但是,爲了真正獲得洞察力,我們還需要考慮其他信息。例如,承擔風險——汽車之家有1個警告信號,我們認爲您應該知道。
If you are like me, then you will not want to miss this free list of undervalued small caps that insiders are buying.
如果您像我一樣,就不會希望錯過這份免費的內部人士正在購買的低估小市值股票列表。
Please note, the market returns quoted in this article reflect the market weighted average returns of stocks that currently trade on American exchanges.
請注意,本文所引述的市場回報反映了目前在美國交易所上市的股票的市場加權平均回報。
Have feedback on this article? Concerned about the content? Get in touch with us directly. Alternatively, email editorial-team (at) simplywallst.com.
This article by Simply Wall St is general in nature. We provide commentary based on historical data and analyst forecasts only using an unbiased methodology and our articles are not intended to be financial advice. It does not constitute a recommendation to buy or sell any stock, and does not take account of your objectives, or your financial situation. We aim to bring you long-term focused analysis driven by fundamental data. Note that our analysis may not factor in the latest price-sensitive company announcements or qualitative material. Simply Wall St has no position in any stocks mentioned.
對本文有反饋?關於內容有所顧慮?直接和我們聯繫。或者,發送電子郵件至editorial-team (at) simplywallst.com。
這篇文章是Simply Wall St的一般性文章。我們根據歷史數據和分析師預測提供評論,只使用公正的方法論,我們的文章並不意味着提供任何金融建議。文章不構成買賣任何股票的建議,也不考慮您的目標或您的財務狀況。我們的目標是帶給您基本數據驅動的長期關注分析。請注意,我們的分析可能不考慮最新的價格敏感公司公告或定性材料。Simply Wall St沒有任何股票頭寸。
譯文內容由第三人軟體翻譯。