
Those Who Invested in Janus Henderson Group (NYSE:JHG) Five Years Ago Are up 105%
Those Who Invested in Janus Henderson Group (NYSE:JHG) Five Years Ago Are up 105%
The main point of investing for the long term is to make money. But more than that, you probably want to see it rise more than the market average. Unfortunately for shareholders, while the Janus Henderson Group plc (NYSE:JHG) share price is up 55% in the last five years, that's less than the market return. However, if you include the dividends then the return is market beating. Zooming in, the stock is up a respectable 17% in the last year.
長期投資的主要目的是賺錢。但不僅如此,您可能希望它漲得比市場平均水平還要高。不幸的是,對於股東來說,儘管Janus Henderson Group股票的價格在過去五年中上漲了55%,但這仍低於市場回報。但是,如果計算股息,則回報率能夠超過市場。具體來說,在過去的一年中,股票的漲幅達到了17%。
Let's take a look at the underlying fundamentals over the longer term, and see if they've been consistent with shareholders returns.
讓我們長期看一下潛在的基本面,看看它們是否與股東回報一致。
There is no denying that markets are sometimes efficient, but prices do not always reflect underlying business performance. By comparing earnings per share (EPS) and share price changes over time, we can get a feel for how investor attitudes to a company have morphed over time.
市場有時候是有效的,但價格並不總是反映公司的基本業務表現。通過比較每股收益和股價變化,我們可以了解投資者對公司的看法如何隨着時間變化而變化。
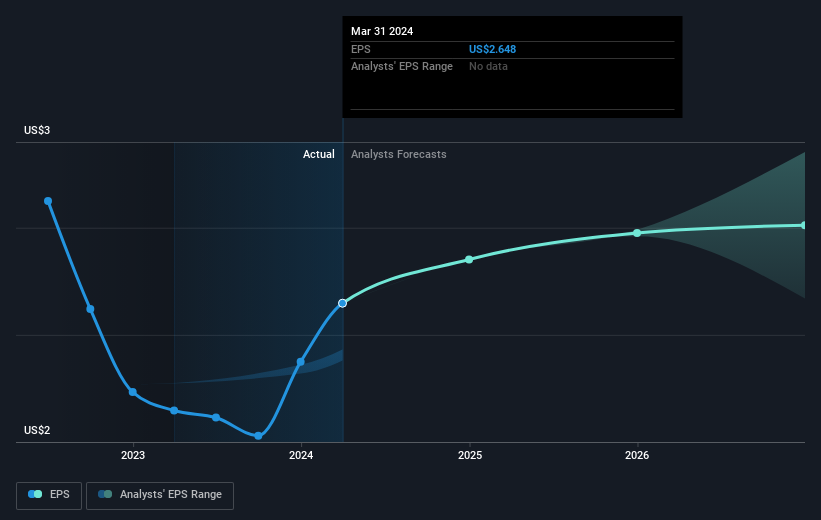
Over half a decade, Janus Henderson Group managed to grow its earnings per share at 3.0% a year. This EPS growth is slower than the share price growth of 9% per year, over the same period. This suggests that market participants hold the company in higher regard, these days. That's not necessarily surprising considering the five-year track record of earnings growth.
在過去的五年中,Janus Henderson Group每股收益的增長率爲3.0%。與此同時,該股票的股價增長率爲每年9%,增長速度更快。這表明市場參與者目前對公司的評價更高。考慮到五年來盈利增長的記錄,這並不奇怪。
You can see how EPS has changed over time in the image below (click on the chart to see the exact values).
您可以在下面的圖片中查看每股收益如何隨時間變化(單擊圖表以查看確切的價值)。
We know that Janus Henderson Group has improved its bottom line lately, but is it going to grow revenue? Check if analysts think Janus Henderson Group will grow revenue in the future.
我們知道Janus Henderson Group的底線最近有所改善,但它是否將增長營業收入呢?請查詢分析師是否認爲Janus Henderson Group將來會增長營業收入。
What About Dividends?
那麼分紅怎麼樣呢?
When looking at investment returns, it is important to consider the difference between total shareholder return (TSR) and share price return. Whereas the share price return only reflects the change in the share price, the TSR includes the value of dividends (assuming they were reinvested) and the benefit of any discounted capital raising or spin-off. Arguably, the TSR gives a more comprehensive picture of the return generated by a stock. We note that for Janus Henderson Group the TSR over the last 5 years was 105%, which is better than the share price return mentioned above. And there's no prize for guessing that the dividend payments largely explain the divergence!
在考慮投資回報時,重要的是考慮總股東回報(TSR)和股票回報之間的差異。 TSR包括任何剝離或折讓的資本籌集(基於股息被重新投資的假設),以及任何股息。因此,對於支付慷慨的股息公司而言,TSR通常比股票回報高得多。就中國神威藥業集團而言,其TSR在過去5年中達到了75%。這超過了我們之前提到的股票回報。該公司支付的股息已經提高了總股東回報。總股東回報和股票回報股價回報只反映了股價的變化,而TSR包括股息的價值(假定它們被再投資)以及任何折價的資本籌集或分拆的好處。可以說,TSR提供了股票產生的回報的更全面的圖片。我們注意到,在過去的5年中,Janus Henderson Group的TSR達到了105%,比上面提到的股價回報要好。毫無疑問,股息支付在很大程度上解釋了這種分歧!
A Different Perspective
不同的觀點
Janus Henderson Group's TSR for the year was broadly in line with the market average, at 24%. Most would be happy with a gain, and it helps that the year's return is actually better than the average return over five years, which was 15%. It is possible that management foresight will bring growth well into the future, even if the share price slows down. It's always interesting to track share price performance over the longer term. But to understand Janus Henderson Group better, we need to consider many other factors. Consider for instance, the ever-present spectre of investment risk. We've identified 2 warning signs with Janus Henderson Group (at least 1 which is concerning) , and understanding them should be part of your investment process.
Janus Henderson Group的TSR一年內與市場平均水平基本持平,爲24%。大多數人都會對獲利感到高興,而今年的回報率實際上比5年平均回報率(15%)更好,這就是一個好消息。即使股價放緩,通過管理遠見,未來也有可能帶來增長。跟蹤股價表現的長期趨勢總是很有趣的。但要更好地了解Janus Henderson Group,我們需要考慮許多其他因素。例如投資風險的普遍存在。我們已經確定了與Janus Henderson Group相關的2個警告信號(至少有1個令人擔憂),了解它們應該是您投資過程的一部分。
Of course Janus Henderson Group may not be the best stock to buy. So you may wish to see this free collection of growth stocks.
當然,Janus Henderson Group可能不是最好的股票選擇。因此,您可能希望查看這些免費的成長股票收藏。
Please note, the market returns quoted in this article reflect the market weighted average returns of stocks that currently trade on American exchanges.
請注意,本文所引述的市場回報反映了目前在美國交易所上市的股票的市場加權平均回報。
Have feedback on this article? Concerned about the content? Get in touch with us directly. Alternatively, email editorial-team (at) simplywallst.com.
This article by Simply Wall St is general in nature. We provide commentary based on historical data and analyst forecasts only using an unbiased methodology and our articles are not intended to be financial advice. It does not constitute a recommendation to buy or sell any stock, and does not take account of your objectives, or your financial situation. We aim to bring you long-term focused analysis driven by fundamental data. Note that our analysis may not factor in the latest price-sensitive company announcements or qualitative material. Simply Wall St has no position in any stocks mentioned.
對本文有反饋?關於內容有所顧慮?直接和我們聯繫。或者,發送電子郵件至editorial-team (at) simplywallst.com。
這篇文章是Simply Wall St的一般性文章。我們根據歷史數據和分析師預測提供評論,只使用公正的方法論,我們的文章並不意味着提供任何金融建議。文章不構成買賣任何股票的建議,也不考慮您的目標或您的財務狀況。我們的目標是帶給您基本數據驅動的長期關注分析。請注意,我們的分析可能不考慮最新的價格敏感公司公告或定性材料。Simply Wall St沒有任何股票頭寸。
譯文內容由第三人軟體翻譯。