
Spectrum Brands Holdings' (NYSE:SPB) Investors Will Be Pleased With Their Respectable 77% Return Over the Last Five Years
Spectrum Brands Holdings' (NYSE:SPB) Investors Will Be Pleased With Their Respectable 77% Return Over the Last Five Years
If you buy and hold a stock for many years, you'd hope to be making a profit. Better yet, you'd like to see the share price move up more than the market average. Unfortunately for shareholders, while the Spectrum Brands Holdings, Inc. (NYSE:SPB) share price is up 56% in the last five years, that's less than the market return. Some buyers are laughing, though, with an increase of 21% in the last year.
如果您購買並持有股票多年,您希望能獲得盈利。更好的是,您希望看到股票價格上漲超過市場平均水平。不幸的是,對於股東來說,雖然Spectrum Brands Holdings, Inc.(NYSE:SPB)股價在過去五年中上漲了56%,但這不足以跑贏市場回報。但在過去一年中,有些買家卻獲得了21%的增長。
Now it's worth having a look at the company's fundamentals too, because that will help us determine if the long term shareholder return has matched the performance of the underlying business.
現在值得更詳細地了解該公司的基本面,因爲這將幫助我們判斷長期股東回報是否與基礎業務的表現相匹配。
While the efficient markets hypothesis continues to be taught by some, it has been proven that markets are over-reactive dynamic systems, and investors are not always rational. One way to examine how market sentiment has changed over time is to look at the interaction between a company's share price and its earnings per share (EPS).
雖然有效市場假說仍然被一些人教授,但被證明市場是過度反應的動態系統,投資者並不總是理性的。檢查市場情緒如何隨時間變化的一種方法是看一個公司的股價與其每股收益(EPS)之間的交互作用。
Spectrum Brands Holdings has made a profit in the past. However, it made a loss in the last twelve months, suggesting profit may be an unreliable metric at this stage. So we might find other metrics can better explain the share price movements.
Spectrum Brands Holdings過去曾經獲利。但在過去十二個月中,它卻虧損了,這表明在這個階段,利潤可能不是一個可靠的指標。因此,我們可能會發現其他指標可以更好地解釋股價運動。
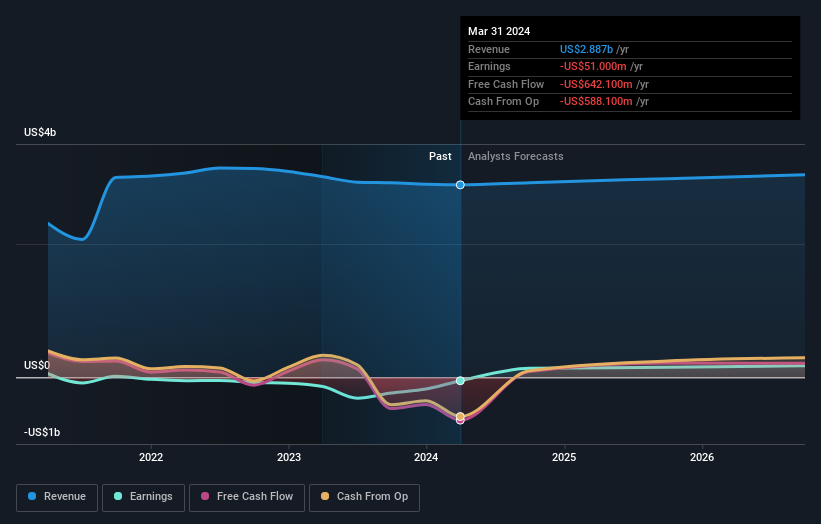
The modest 1.9% dividend yield is unlikely to be propping up the share price. It is not great to see that revenue has dropped by 3.6% per year over five years. So it seems one might have to take closer look at earnings and revenue trends to see how they might influence the share price.
適度的1.9%股息收益率不太可能支撐股價。很不好看到收入在過去五年中每年下降3.6%。因此,似乎必須更 closely審視收益和營收趨勢,以了解它們可能如何影響股價。
The graphic below depicts how earnings and revenue have changed over time (unveil the exact values by clicking on the image).
下面的圖表顯示了收益和營收隨時間的變化情況(通過單擊圖像揭示確切的值)。
We consider it positive that insiders have made significant purchases in the last year. Having said that, most people consider earnings and revenue growth trends to be a more meaningful guide to the business. You can see what analysts are predicting for Spectrum Brands Holdings in this interactive graph of future profit estimates.
我們認爲內部人士在過去一年中作出重大購買是積極的。儘管如此,大多數人認爲收益和營收增長趨勢是業務更有意義的指導。您可以在此與分析師預測的Spectrum Brands Holdings未來利潤估計交互式圖表中看到。
What About Dividends?
那麼分紅怎麼樣呢?
As well as measuring the share price return, investors should also consider the total shareholder return (TSR). Whereas the share price return only reflects the change in the share price, the TSR includes the value of dividends (assuming they were reinvested) and the benefit of any discounted capital raising or spin-off. So for companies that pay a generous dividend, the TSR is often a lot higher than the share price return. We note that for Spectrum Brands Holdings the TSR over the last 5 years was 77%, which is better than the share price return mentioned above. The dividends paid by the company have thusly boosted the total shareholder return.
除了衡量股票回報率外,投資者還應考慮總股東回報率(TSR)。而股票回報率只反映了股票價格的變化,TSR還包括股息的價值(假設它們被再投資)以及任何折扣資本籌集或分拆的利益。因此,對於支付慷慨股息的公司,TSR通常比股票回報率高得多。我們注意到,Spectrum Brands Holdings在過去5年中的TSR爲77%,比上述股票回報率更好。公司支付的股息因此提高了。。。總股東回報。
A Different Perspective
不同的觀點
Spectrum Brands Holdings provided a TSR of 24% over the year (including dividends). That's fairly close to the broader market return. Most would be happy with a gain, and it helps that the year's return is actually better than the average return over five years, which was 12%. It is possible that management foresight will bring growth well into the future, even if the share price slows down. It's always interesting to track share price performance over the longer term. But to understand Spectrum Brands Holdings better, we need to consider many other factors. Even so, be aware that Spectrum Brands Holdings is showing 1 warning sign in our investment analysis , you should know about...
Spectrum Brands Holdings在過去一年中提供了23%的TSR(包括股息)。那相當接近更廣泛的市場回報。大多數人會爲收益而高興,因爲這一年的回報實際上比五年的平均回報(12%)要好。即使股票價格放緩,管理層的遠見也可能會帶來未來的增長。追蹤股票長期表現總是很有趣的。但是爲了更好地了解Spectrum Brands Holdings,我們需要考慮許多其他因素 但即便如此,請注意,在我們的投資分析中,Spectrum Brands Holdings正在顯示一個警告,請注意。。。
There are plenty of other companies that have insiders buying up shares. You probably do not want to miss this free list of undervalued small cap companies that insiders are buying.
還有很多其他的公司,公司的內部人士正在購買股票。你可能不想錯過這個免費的小市值公司的低估列表。
Please note, the market returns quoted in this article reflect the market weighted average returns of stocks that currently trade on American exchanges.
請注意,本文所引述的市場回報反映了目前在美國交易所上市的股票的市場加權平均回報。
Have feedback on this article? Concerned about the content? Get in touch with us directly. Alternatively, email editorial-team (at) simplywallst.com.
This article by Simply Wall St is general in nature. We provide commentary based on historical data and analyst forecasts only using an unbiased methodology and our articles are not intended to be financial advice. It does not constitute a recommendation to buy or sell any stock, and does not take account of your objectives, or your financial situation. We aim to bring you long-term focused analysis driven by fundamental data. Note that our analysis may not factor in the latest price-sensitive company announcements or qualitative material. Simply Wall St has no position in any stocks mentioned.
對本文有反饋?關於內容有所顧慮?直接和我們聯繫。或者,發送電子郵件至editorial-team (at) simplywallst.com。
這篇文章是Simply Wall St的一般性文章。我們根據歷史數據和分析師預測提供評論,只使用公正的方法論,我們的文章並不意味着提供任何金融建議。文章不構成買賣任何股票的建議,也不考慮您的目標或您的財務狀況。我們的目標是帶給您基本數據驅動的長期關注分析。請注意,我們的分析可能不考慮最新的價格敏感公司公告或定性材料。Simply Wall St沒有任何股票頭寸。
譯文內容由第三人軟體翻譯。