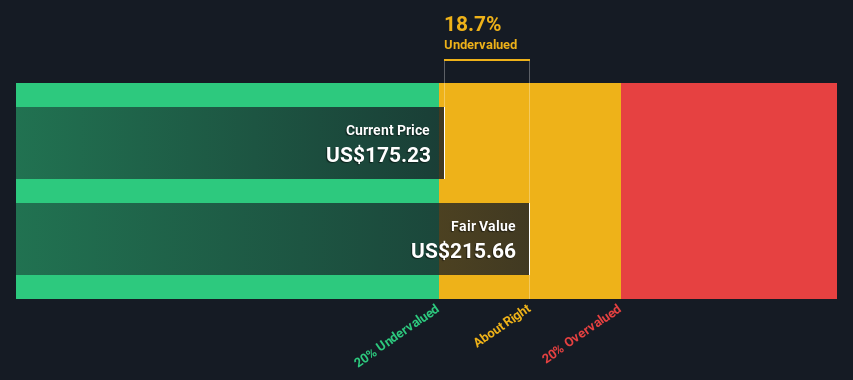
The projected fair value for Quaker Chemical is US$216 based on 2 Stage Free Cash Flow to Equity
Quaker Chemical's US$175 share price indicates it is trading at similar levels as its fair value estimate
The US$232 analyst price target for KWR is 7.6% more than our estimate of fair value
Today we'll do a simple run through of a valuation method used to estimate the attractiveness of Quaker Chemical Corporation (NYSE:KWR) as an investment opportunity by projecting its future cash flows and then discounting them to today's value. We will take advantage of the Discounted Cash Flow (DCF) model for this purpose. Believe it or not, it's not too difficult to follow, as you'll see from our example!
Companies can be valued in a lot of ways, so we would point out that a DCF is not perfect for every situation. For those who are keen learners of equity analysis, the Simply Wall St analysis model here may be something of interest to you.
The Calculation
We are going to use a two-stage DCF model, which, as the name states, takes into account two stages of growth. The first stage is generally a higher growth period which levels off heading towards the terminal value, captured in the second 'steady growth' period. To start off with, we need to estimate the next ten years of cash flows. Where possible we use analyst estimates, but when these aren't available we extrapolate the previous free cash flow (FCF) from the last estimate or reported value. We assume companies with shrinking free cash flow will slow their rate of shrinkage, and that companies with growing free cash flow will see their growth rate slow, over this period. We do this to reflect that growth tends to slow more in the early years than it does in later years.
Generally we assume that a dollar today is more valuable than a dollar in the future, and so the sum of these future cash flows is then discounted to today's value:
10-year free cash flow (FCF) forecast
2024
2025
2026
2027
2028
2029
2030
2031
2032
2033
Levered FCF ($, Millions)
US$179.9m
US$189.0m
US$196.3m
US$203.0m
US$209.3m
US$215.3m
US$221.2m
US$227.0m
US$232.8m
US$238.6m
Growth Rate Estimate Source
Analyst x3
Analyst x2
Est @ 3.86%
Est @ 3.42%
Est @ 3.11%
Est @ 2.89%
Est @ 2.74%
Est @ 2.63%
Est @ 2.55%
Est @ 2.50%
Present Value ($, Millions) Discounted @ 7.3%
US$168
US$164
US$159
US$153
US$147
US$141
US$135
US$129
US$123
US$118
("Est" = FCF growth rate estimated by Simply Wall St) Present Value of 10-year Cash Flow (PVCF) = US$1.4b
The second stage is also known as Terminal Value, this is the business's cash flow after the first stage. The Gordon Growth formula is used to calculate Terminal Value at a future annual growth rate equal to the 5-year average of the 10-year government bond yield of 2.4%. We discount the terminal cash flows to today's value at a cost of equity of 7.3%.
Present Value of Terminal Value (PVTV)= TV / (1 + r)10= US$4.9b÷ ( 1 + 7.3%)10= US$2.4b
The total value, or equity value, is then the sum of the present value of the future cash flows, which in this case is US$3.9b. In the final step we divide the equity value by the number of shares outstanding. Relative to the current share price of US$175, the company appears about fair value at a 19% discount to where the stock price trades currently. Remember though, that this is just an approximate valuation, and like any complex formula - garbage in, garbage out.
NYSE:KWR Discounted Cash Flow June 8th 2024
The Assumptions
Now the most important inputs to a discounted cash flow are the discount rate, and of course, the actual cash flows. You don't have to agree with these inputs, I recommend redoing the calculations yourself and playing with them. The DCF also does not consider the possible cyclicality of an industry, or a company's future capital requirements, so it does not give a full picture of a company's potential performance. Given that we are looking at Quaker Chemical as potential shareholders, the cost of equity is used as the discount rate, rather than the cost of capital (or weighted average cost of capital, WACC) which accounts for debt. In this calculation we've used 7.3%, which is based on a levered beta of 1.073. Beta is a measure of a stock's volatility, compared to the market as a whole. We get our beta from the industry average beta of globally comparable companies, with an imposed limit between 0.8 and 2.0, which is a reasonable range for a stable business.
SWOT Analysis for Quaker Chemical
Strength
Debt is well covered by earnings and cashflows.
Dividends are covered by earnings and cash flows.
Dividend information for KWR.
Weakness
Dividend is low compared to the top 25% of dividend payers in the Chemicals market.
Opportunity
Annual earnings are forecast to grow faster than the American market.
Current share price is below our estimate of fair value.
Threat
Annual revenue is forecast to grow slower than the American market.
What else are analysts forecasting for KWR?
Looking Ahead:
Valuation is only one side of the coin in terms of building your investment thesis, and it shouldn't be the only metric you look at when researching a company. DCF models are not the be-all and end-all of investment valuation. Rather it should be seen as a guide to "what assumptions need to be true for this stock to be under/overvalued?" For instance, if the terminal value growth rate is adjusted slightly, it can dramatically alter the overall result. For Quaker Chemical, we've put together three further factors you should look at:
Risks: Case in point, we've spotted 1 warning sign for Quaker Chemical you should be aware of.
Future Earnings: How does KWR's growth rate compare to its peers and the wider market? Dig deeper into the analyst consensus number for the upcoming years by interacting with our free analyst growth expectation chart.
Other Solid Businesses: Low debt, high returns on equity and good past performance are fundamental to a strong business. Why not explore our interactive list of stocks with solid business fundamentals to see if there are other companies you may not have considered!
PS. The Simply Wall St app conducts a discounted cash flow valuation for every stock on the NYSE every day. If you want to find the calculation for other stocks just search here.
Have feedback on this article? Concerned about the content?Get in touch with us directly. Alternatively, email editorial-team (at) simplywallst.com. This article by Simply Wall St is general in nature. We provide commentary based on historical data and analyst forecasts only using an unbiased methodology and our articles are not intended to be financial advice. It does not constitute a recommendation to buy or sell any stock, and does not take account of your objectives, or your financial situation. We aim to bring you long-term focused analysis driven by fundamental data. Note that our analysis may not factor in the latest price-sensitive company announcements or qualitative material. Simply Wall St has no position in any stocks mentioned.
主要見解
基於2階段自由現金流估值,Quaker Chemical的預計公允價值爲216美元。
Quaker Chemical的股價175美元表示其交易價格與公允價值估算相似。
第一分析師的價格目標爲232美元,比我們的公允價值估計高出7.6%。
今天我們將通過預測未來現金流並將其折現到今天的價值來運行一個DCF模型以評估Quaker Chemical Corporation(NYSE: KWR)的吸引力作爲投資機會。信不信由你,從我們的例子中,你會看到它並不太難跟進!