
Quanex Building Products (NYSE:NX) Sheds 5.2% This Week, as Yearly Returns Fall More in Line With Earnings Growth
Quanex Building Products (NYSE:NX) Sheds 5.2% This Week, as Yearly Returns Fall More in Line With Earnings Growth
Quanex Building Products Corporation (NYSE:NX) shareholders have seen the share price descend 12% over the month. But the silver lining is the stock is up over five years. However we are not very impressed because the share price is only up 71%, less than the market return of 97%.
Quanex Building Products Corporation(紐交所:NX)的股東們在本月看到該公司股價下降了12%。 但好消息是,該股票在過去五年上漲。 但我們並不是很滿意,因爲股價上漲僅爲71%,低於市場回報率的97%。
In light of the stock dropping 5.2% in the past week, we want to investigate the longer term story, and see if fundamentals have been the driver of the company's positive five-year return.
鑑於該股票在過去一週下跌了5.2%,我們想研究更長期的情況,並查看公司正面的五年回報是否是由基本面所驅動。
To quote Buffett, 'Ships will sail around the world but the Flat Earth Society will flourish. There will continue to be wide discrepancies between price and value in the marketplace...' One flawed but reasonable way to assess how sentiment around a company has changed is to compare the earnings per share (EPS) with the share price.
引用巴菲特的話說,“船隻會在世界各地航行,但是持平地球學會會蓬勃發展。在市場上,價格和價值之間將繼續存在巨大的差距……”評估公司周圍情緒變化的一種有缺陷但合理的方法是將每股收益(EPS)與股價進行比較。
During five years of share price growth, Quanex Building Products achieved compound earnings per share (EPS) growth of 38% per year. This EPS growth is higher than the 11% average annual increase in the share price. So it seems the market isn't so enthusiastic about the stock these days. The reasonably low P/E ratio of 11.62 also suggests market apprehension.
在五年的股價上漲期間,Quanex Building Products實現了每股收益(EPS)年平均增長率爲38%的複合增長率。這種EPS增長率高於股價每年平均增長率的11%。所以看來市場對這隻股票並不那麼熱情。 它相對較低的市盈率爲11.62也表明市場擔憂。
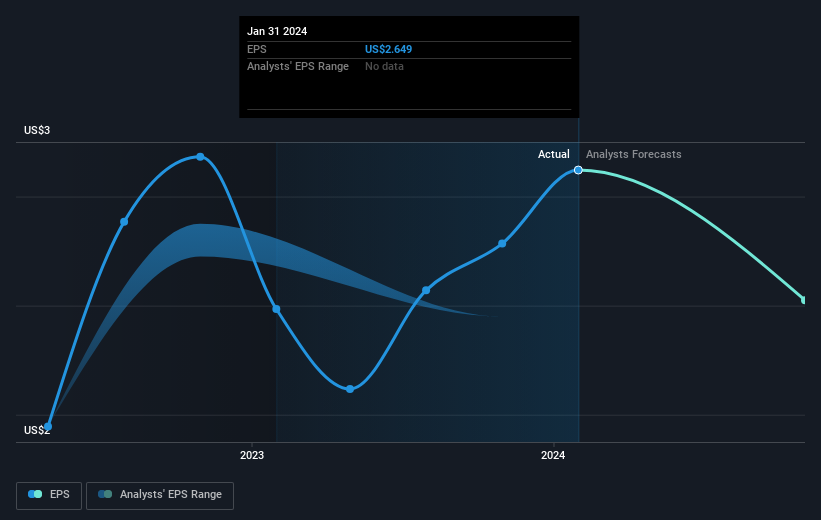
The graphic below depicts how EPS has changed over time (unveil the exact values by clicking on the image).
下圖顯示了EPS隨時間變化的情況(點擊圖像以顯示確切值)。
We know that Quanex Building Products has improved its bottom line lately, but is it going to grow revenue? If you're interested, you could check this free report showing consensus revenue forecasts.
我們知道Quanex Building Products最近改善了其底線,但它是否會增長營業收入? 如果您感興趣,您可以查看這份免費報告,了解共識營收預測。
What About Dividends?
那麼分紅怎麼樣呢?
When looking at investment returns, it is important to consider the difference between total shareholder return (TSR) and share price return. The TSR incorporates the value of any spin-offs or discounted capital raisings, along with any dividends, based on the assumption that the dividends are reinvested. So for companies that pay a generous dividend, the TSR is often a lot higher than the share price return. In the case of Quanex Building Products, it has a TSR of 84% for the last 5 years. That exceeds its share price return that we previously mentioned. The dividends paid by the company have thusly boosted the total shareholder return.
在考慮投資回報時,重要的是考慮總股東回報(TSR)和股票回報之間的差異。 TSR包括任何剝離或折讓的資本籌集(基於股息被重新投資的假設),以及任何股息。因此,對於支付慷慨的股息公司而言,TSR通常比股票回報高得多。就中國神威藥業集團而言,其TSR在過去5年中達到了75%。這超過了我們之前提到的股票回報。該公司支付的股息已經提高了總股東回報。總股東回報和股票回報TSR考慮了任何分拆或折價融資的價值,以及任何股息,假設股息被再次投資。因此,對於支付豐厚股息的公司而言,TSR通常比股票回報率高得多。在Quanex Building Products的情況下,過去5年的TSR爲84%。這超過了我們之前提到的股價回報率。該公司支付的股息已經提高了總股東回報。
A Different Perspective
不同的觀點
Quanex Building Products shareholders are up 14% for the year (even including dividends). Unfortunately this falls short of the market return. On the bright side, that's still a gain, and it's actually better than the average return of 13% over half a decade This suggests the company might be improving over time. Most investors take the time to check the data on insider transactions. You can click here to see if insiders have been buying or selling.
Quanex Building Products的股東今年的回報率爲14%(包括股息)。 不幸的是,這低於市場回報率。好消息是,這仍然是一筆收入,並且實際上比半個十年的平均回報率13%要好。這表明該公司隨着時間的推移可能正在改善。大多數投資者都會花時間檢查內部交易的數據。 您可以單擊此處查看內部人員是否一直在購買或銷售。
If you would prefer to check out another company -- one with potentially superior financials -- then do not miss this free list of companies that have proven they can grow earnings.
如果您願意查看另一家公司-具有潛在更優質財務狀況的公司-則不要錯過這個免費的公司列表,這些公司已經證明他們可以增長收益。
Please note, the market returns quoted in this article reflect the market weighted average returns of stocks that currently trade on American exchanges.
請注意,本文所引述的市場回報反映了目前在美國交易所上市的股票的市場加權平均回報。
Have feedback on this article? Concerned about the content? Get in touch with us directly. Alternatively, email editorial-team (at) simplywallst.com.
This article by Simply Wall St is general in nature. We provide commentary based on historical data and analyst forecasts only using an unbiased methodology and our articles are not intended to be financial advice. It does not constitute a recommendation to buy or sell any stock, and does not take account of your objectives, or your financial situation. We aim to bring you long-term focused analysis driven by fundamental data. Note that our analysis may not factor in the latest price-sensitive company announcements or qualitative material. Simply Wall St has no position in any stocks mentioned.
對本文有反饋?關於內容有所顧慮?直接和我們聯繫。或者,發送電子郵件至editorial-team (at) simplywallst.com。
這篇文章是Simply Wall St的一般性文章。我們根據歷史數據和分析師預測提供評論,只使用公正的方法論,我們的文章並不意味着提供任何金融建議。文章不構成買賣任何股票的建議,也不考慮您的目標或您的財務狀況。我們的目標是帶給您基本數據驅動的長期關注分析。請注意,我們的分析可能不考慮最新的價格敏感公司公告或定性材料。Simply Wall St沒有任何股票頭寸。
譯文內容由第三人軟體翻譯。