
The Total Return for UFP Technologies (NASDAQ:UFPT) Investors Has Risen Faster Than Earnings Growth Over the Last Five Years
The Total Return for UFP Technologies (NASDAQ:UFPT) Investors Has Risen Faster Than Earnings Growth Over the Last Five Years
Buying shares in the best businesses can build meaningful wealth for you and your family. While not every stock performs well, when investors win, they can win big. To wit, the UFP Technologies, Inc. (NASDAQ:UFPT) share price has soared 526% over five years. If that doesn't get you thinking about long term investing, we don't know what will. It's also good to see the share price up 26% over the last quarter. Anyone who held for that rewarding ride would probably be keen to talk about it.
投資最佳企業的股票可以爲您和您的家庭創造有意義的財富。雖然並非每支股票都表現良好,但當投資者獲勝時,他們可以贏得巨大的回報。就拿UFP Technologies,Inc. (納斯達克:UFPT)的股價在過去五年中飆升了526%來說,這應該能讓您考慮長期投資。股價在最後一個季度上漲了26%也很不錯。任何持有這個有利可圖的股票的人都可能熱衷於談論它。
While this past week has detracted from the company's five-year return, let's look at the recent trends of the underlying business and see if the gains have been in alignment.
雖然過去的一週削弱了公司的五年回報,但讓我們看看業務的最近趨勢,並查看收益是否已對齊。
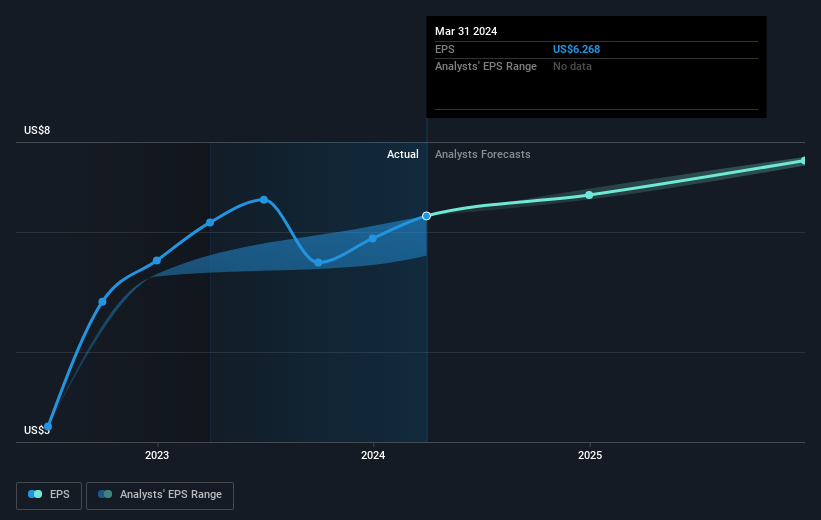
While markets are a powerful pricing mechanism, share prices reflect investor sentiment, not just underlying business performance. One way to examine how market sentiment has changed over time is to look at the interaction between a company's share price and its earnings per share (EPS).
儘管市場是一個強大的價格機制,但股票價格反映的不僅是潛在業務績效,還反映了投資者的情緒。 了解市場情緒隨時間的變化的一種方法是查看公司的股價與每股收益(EPS)之間的互動。
Over half a decade, UFP Technologies managed to grow its earnings per share at 23% a year. This EPS growth is slower than the share price growth of 44% per year, over the same period. So it's fair to assume the market has a higher opinion of the business than it did five years ago. And that's hardly shocking given the track record of growth.
在過去的五年中,UFP Technologies平均每年將每股收益增長23%。與同期每年股價增長44%相比,這種每股收益增長速度較慢。因此,可以合理地假設市場對這家公司的看法比五年前更高。鑑於其增長記錄,這並不令人驚訝。
You can see below how EPS has changed over time (discover the exact values by clicking on the image).
下面可以看到每股收益隨時間的變化情況(通過點擊圖像來查看確切數值)。
It is of course excellent to see how UFP Technologies has grown profits over the years, but the future is more important for shareholders. This free interactive report on UFP Technologies' balance sheet strength is a great place to start, if you want to investigate the stock further.
當然,看到UFP Technologies多年來的利潤增長是非常出色的,但未來對股東來說更爲重要。如果您想進一步調查該股票,UFP Technologies資產負債表強度的免費互動報告是一個很好的開始。
A Different Perspective
不同的觀點
We're pleased to report that UFP Technologies shareholders have received a total shareholder return of 49% over one year. Since the one-year TSR is better than the five-year TSR (the latter coming in at 44% per year), it would seem that the stock's performance has improved in recent times. Given the share price momentum remains strong, it might be worth taking a closer look at the stock, lest you miss an opportunity. If you would like to research UFP Technologies in more detail then you might want to take a look at whether insiders have been buying or selling shares in the company.
我們很高興地報告,UFP Technologies股東已經獲得了49%的總股東回報率,超過了一年前的股東回報率(後者每年爲44%)。這似乎表明該股票的表現近來有所改善。鑑於股價的勢頭仍然強勁,如果您不想錯過機會,就值得更仔細地研究該股票。如果您想更詳細地研究UFP Technologies,您可能需要查看公司內部人員是否一直在買賣股票。
Of course, you might find a fantastic investment by looking elsewhere. So take a peek at this free list of companies we expect will grow earnings.
當然,您可能在其他地方找到一家出色的企業進行投資。因此,請查看我們預計將實現盈利增長的公司的免費列表。
Please note, the market returns quoted in this article reflect the market weighted average returns of stocks that currently trade on American exchanges.
請注意,本文所引述的市場回報反映了目前在美國交易所上市的股票的市場加權平均回報。
Have feedback on this article? Concerned about the content? Get in touch with us directly. Alternatively, email editorial-team (at) simplywallst.com.
This article by Simply Wall St is general in nature. We provide commentary based on historical data and analyst forecasts only using an unbiased methodology and our articles are not intended to be financial advice. It does not constitute a recommendation to buy or sell any stock, and does not take account of your objectives, or your financial situation. We aim to bring you long-term focused analysis driven by fundamental data. Note that our analysis may not factor in the latest price-sensitive company announcements or qualitative material. Simply Wall St has no position in any stocks mentioned.
對本文有反饋?關於內容有所顧慮?直接和我們聯繫。或者,發送電子郵件至editorial-team (at) simplywallst.com。
這篇文章是Simply Wall St的一般性文章。我們根據歷史數據和分析師預測提供評論,只使用公正的方法論,我們的文章並不意味着提供任何金融建議。文章不構成買賣任何股票的建議,也不考慮您的目標或您的財務狀況。我們的目標是帶給您基本數據驅動的長期關注分析。請注意,我們的分析可能不考慮最新的價格敏感公司公告或定性材料。Simply Wall St沒有任何股票頭寸。
譯文內容由第三人軟體翻譯。