
Commercial Metals (NYSE:CMC) Shareholders Have Earned a 31% CAGR Over the Last Five Years
Commercial Metals (NYSE:CMC) Shareholders Have Earned a 31% CAGR Over the Last Five Years
The most you can lose on any stock (assuming you don't use leverage) is 100% of your money. But on a lighter note, a good company can see its share price rise well over 100%. One great example is Commercial Metals Company (NYSE:CMC) which saw its share price drive 259% higher over five years. The last week saw the share price soften some 2.0%.
在任何一隻股票上你最多可以虧損100%的資金(假設你沒有使用槓桿)。但好的公司股價的漲幅可以超過100%。一個很好的例子是Commercial Metals Company(紐約證交所:CMC),其股價在五年內飆升了259%。上週該股股價有所回落,下跌了2.0%。
With that in mind, it's worth seeing if the company's underlying fundamentals have been the driver of long term performance, or if there are some discrepancies.
鑑於此,值得看看該公司的基本面是否一直是長期業績的驅動因素,或者是否存在一些不一致之處。
While markets are a powerful pricing mechanism, share prices reflect investor sentiment, not just underlying business performance. One way to examine how market sentiment has changed over time is to look at the interaction between a company's share price and its earnings per share (EPS).
儘管市場是一個強大的價格機制,但股票價格反映的不僅是潛在業務績效,還反映了投資者的情緒。 了解市場情緒隨時間的變化的一種方法是查看公司的股價與每股收益(EPS)之間的互動。
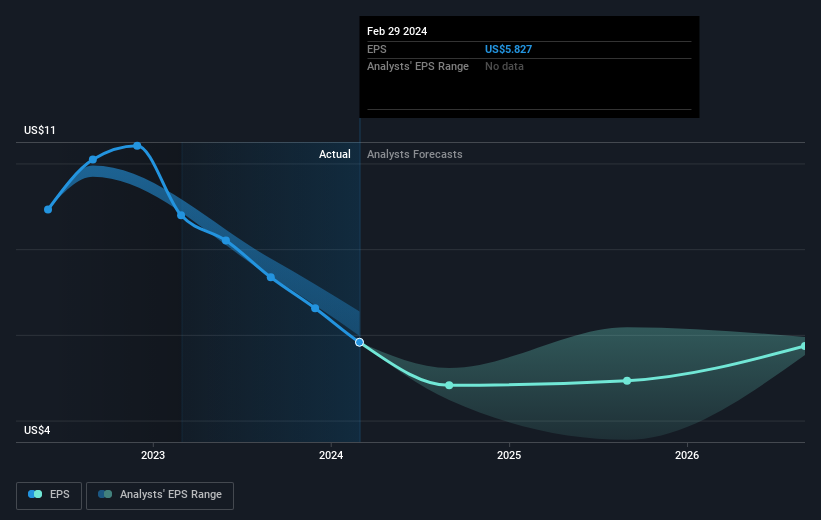
Over half a decade, Commercial Metals managed to grow its earnings per share at 40% a year. This EPS growth is higher than the 29% average annual increase in the share price. Therefore, it seems the market has become relatively pessimistic about the company. This cautious sentiment is reflected in its (fairly low) P/E ratio of 9.07.
在五年的時間裏,Commercial Metals成功地將每股收益增長了40%。這一EPS增長高於股價每年平均增長率的29%。因此,市場對這家公司變得相對悲觀。這種謹慎情緒反映在它的(相當低的)市盈率爲9.07。
The company's earnings per share (over time) is depicted in the image below (click to see the exact numbers).
該公司的每股收益(隨時間的推移)如下圖所示(單擊可查看確切數字)。
We like that insiders have been buying shares in the last twelve months. Even so, future earnings will be far more important to whether current shareholders make money. Dive deeper into the earnings by checking this interactive graph of Commercial Metals' earnings, revenue and cash flow.
我們喜歡看到內部人士在過去十二個月裏一直在購買股票。即使如此,未來的盈利對於股東是否賺錢將更加重要。通過查看Commercial Metals的盈利、營業收入和現金流的交互圖來深入了解它的盈利。
What About Dividends?
那麼分紅怎麼樣呢?
It is important to consider the total shareholder return, as well as the share price return, for any given stock. The TSR incorporates the value of any spin-offs or discounted capital raisings, along with any dividends, based on the assumption that the dividends are reinvested. It's fair to say that the TSR gives a more complete picture for stocks that pay a dividend. In the case of Commercial Metals, it has a TSR of 293% for the last 5 years. That exceeds its share price return that we previously mentioned. This is largely a result of its dividend payments!
在考慮任何給定的股票的股價回報和股東回報時,考慮總股東回報是很重要的。TSR包括任何分拆或折價資本籌集的價值,以及任何股息,基於股息再投資的假設。可以說TSR爲支付股息的股票提供了更完整的圖片。在Commercial Metals的情況下,它在過去的5年中TSR爲293%。它超過了我們之前提到的股價回報。這主要是由於其股息支付所致!
A Different Perspective
不同的觀點
Commercial Metals shareholders gained a total return of 15% during the year. Unfortunately this falls short of the market return. On the bright side, the longer term returns (running at about 31% a year, over half a decade) look better. It's quite possible the business continues to execute with prowess, even as the share price gains are slowing. I find it very interesting to look at share price over the long term as a proxy for business performance. But to truly gain insight, we need to consider other information, too. To that end, you should learn about the 2 warning signs we've spotted with Commercial Metals (including 1 which is a bit unpleasant) .
Commercial Metals的股東在過去一年中總共獲得了15%的回報。不幸的是,這低於市場回報水平。從積極方面來看,從長期來看(超過半個世紀,每年約爲31%),回報可能看上去更好。儘管股價增長正在放緩,但業務可能會繼續表現出色。我認爲長期觀察股價作爲業務表現的代理非常有趣。但爲了真正獲得洞察,我們需要考慮其他信息。爲此,您應該了解我們發現的有關Commercial Metals的2種警告信號(其中一個有點不愉快)。
There are plenty of other companies that have insiders buying up shares. You probably do not want to miss this free list of undervalued small cap companies that insiders are buying.
還有很多其他的公司,公司的內部人士正在購買股票。你可能不想錯過這個免費的小市值公司的低估列表。
Please note, the market returns quoted in this article reflect the market weighted average returns of stocks that currently trade on American exchanges.
請注意,本文所引述的市場回報反映了目前在美國交易所上市的股票的市場加權平均回報。
Have feedback on this article? Concerned about the content? Get in touch with us directly. Alternatively, email editorial-team (at) simplywallst.com.
This article by Simply Wall St is general in nature. We provide commentary based on historical data and analyst forecasts only using an unbiased methodology and our articles are not intended to be financial advice. It does not constitute a recommendation to buy or sell any stock, and does not take account of your objectives, or your financial situation. We aim to bring you long-term focused analysis driven by fundamental data. Note that our analysis may not factor in the latest price-sensitive company announcements or qualitative material. Simply Wall St has no position in any stocks mentioned.
對本文有反饋?關於內容有所顧慮?直接和我們聯繫。或者,發送電子郵件至editorial-team (at) simplywallst.com。
這篇文章是Simply Wall St的一般性文章。我們根據歷史數據和分析師預測提供評論,只使用公正的方法論,我們的文章並不意味着提供任何金融建議。文章不構成買賣任何股票的建議,也不考慮您的目標或您的財務狀況。我們的目標是帶給您基本數據驅動的長期關注分析。請注意,我們的分析可能不考慮最新的價格敏感公司公告或定性材料。Simply Wall St沒有任何股票頭寸。
譯文內容由第三人軟體翻譯。