Despite an already strong run, Parkson Retail Asia Limited (SGX:O9E) shares have been powering on, with a gain of 39% in the last thirty days. Not all shareholders will be feeling jubilant, since the share price is still down a very disappointing 10% in the last twelve months.
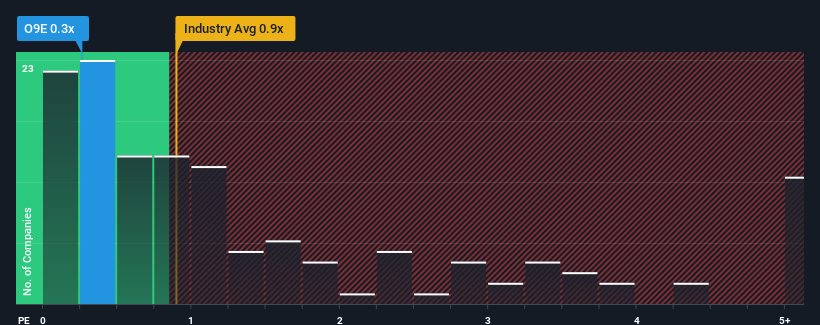
Even after such a large jump in price, Parkson Retail Asia's price-to-sales (or "P/S") ratio of 0.3x might still make it look like a buy right now compared to the Multiline Retail industry in Singapore, where around half of the companies have P/S ratios above 0.8x and even P/S above 4x are quite common. However, the P/S might be low for a reason and it requires further investigation to determine if it's justified.
SGX:O9E Price to Sales Ratio vs Industry June 3rd 2024
What Does Parkson Retail Asia's Recent Performance Look Like?
For example, consider that Parkson Retail Asia's financial performance has been poor lately as its revenue has been in decline. One possibility is that the P/S is low because investors think the company won't do enough to avoid underperforming the broader industry in the near future. Those who are bullish on Parkson Retail Asia will be hoping that this isn't the case so that they can pick up the stock at a lower valuation.
Although there are no analyst estimates available for Parkson Retail Asia, take a look at this free data-rich visualisation to see how the company stacks up on earnings, revenue and cash flow.
How Is Parkson Retail Asia's Revenue Growth Trending?
There's an inherent assumption that a company should underperform the industry for P/S ratios like Parkson Retail Asia's to be considered reasonable.
In reviewing the last year of financials, we were disheartened to see the company's revenues fell to the tune of 6.3%. That put a dampener on the good run it was having over the longer-term as its three-year revenue growth is still a noteworthy 29% in total. Accordingly, while they would have preferred to keep the run going, shareholders would be roughly satisfied with the medium-term rates of revenue growth.
Comparing that to the industry, which is predicted to deliver 9.5% growth in the next 12 months, the company's momentum is pretty similar based on recent medium-term annualised revenue results.
In light of this, it's peculiar that Parkson Retail Asia's P/S sits below the majority of other companies. It may be that most investors are not convinced the company can maintain recent growth rates.
What We Can Learn From Parkson Retail Asia's P/S?
Despite Parkson Retail Asia's share price climbing recently, its P/S still lags most other companies. We'd say the price-to-sales ratio's power isn't primarily as a valuation instrument but rather to gauge current investor sentiment and future expectations.
The fact that Parkson Retail Asia currently trades at a low P/S relative to the industry is unexpected considering its recent three-year growth is in line with the wider industry forecast. When we see industry-like revenue growth but a lower than expected P/S, we assume potential risks are what might be placing downward pressure on the share price. revenue trends suggest that the risk of a price decline is low, investors appear to perceive a possibility of revenue volatility in the future.
You should always think about risks. Case in point, we've spotted 2 warning signs for Parkson Retail Asia you should be aware of.
If companies with solid past earnings growth is up your alley, you may wish to see this free collection of other companies with strong earnings growth and low P/E ratios.
Have feedback on this article? Concerned about the content? Get in touch with us directly. Alternatively, email editorial-team (at) simplywallst.com.
This article by Simply Wall St is general in nature. We provide commentary based on historical data and analyst forecasts only using an unbiased methodology and our articles are not intended to be financial advice. It does not constitute a recommendation to buy or sell any stock, and does not take account of your objectives, or your financial situation. We aim to bring you long-term focused analysis driven by fundamental data. Note that our analysis may not factor in the latest price-sensitive company announcements or qualitative material. Simply Wall St has no position in any stocks mentioned.
百盛零售亞洲(新交所股票代碼:O9E)的股價儘管已經表現強勁,但在過去三十天裏仍取得了39%的漲幅。 並非所有股東都會感到歡欣鼓舞,因爲股價在過去十二個月中仍然下跌了非常令人失望的10%。
即使在價格大幅上漲之後,與新加坡的多線零售行業相比,百盛零售亞洲0.3倍的市銷率(或 “市盈率”)目前仍可能看起來像買入。在新加坡,大約一半的公司的市銷率高於0.8倍,甚至市盈率高於4倍也很常見。但是,市銷率低可能是有原因的,需要進一步調查以確定其是否合理。
2024 年 6 月 3 日新加坡交易所:O9E 與行業的股價銷售比率
百盛零售亞洲最近的表現如何?
例如,假設由於收入下降,百盛零售亞洲最近的財務表現不佳。一種可能性是市銷率很低,因爲投資者認爲公司在不久的將來在避免整個行業表現不佳方面做得還不夠。那些看好百盛零售亞洲的人會希望情況並非如此,這樣他們就可以以較低的估值買入該股。
儘管尚無分析師對百盛零售亞洲的估計,但請看一下這個免費的數據豐富的可視化工具,看看該公司的收益、收入和現金流是如何積累的。
百盛零售亞洲的收入增長趨勢如何?
人們固有的假設是,如果像百盛零售亞洲這樣的市銷率被認爲是合理的,公司的表現應該低於該行業。
在回顧去年的財務狀況時,我們沮喪地看到該公司的收入下降至6.3%。這抑制了其長期的良好表現,因爲其三年總收入增長仍爲29%,值得注意的是。因此,儘管股東本來希望繼續經營,但他們會對中期收入增長率大致滿意。
相比之下,該行業預計將在未來12個月內實現9.5%的增長,根據最近的中期年化收入業績,該公司的勢頭非常相似。
有鑑於此,奇怪的是,百盛零售亞洲的市銷率低於其他多數公司。可能是大多數投資者不相信公司能夠維持最近的增長率。
我們可以從百盛零售亞洲的市銷率中學到什麼?
儘管百盛零售亞洲股價最近攀升,但其市銷率仍然落後於其他大部分公司。我們可以說,市銷比率的力量主要不是作爲一種估值工具,而是用來衡量當前的投資者情緒和未來預期。
考慮到百盛零售亞洲最近三年的增長,目前相對於該行業而言,其市銷率較低,這一事實出人意料,這與更廣泛的行業預測一致。當我們看到與行業相似的收入增長但市銷率低於預期時,我們假設潛在風險可能給股價帶來下行壓力。收入趨勢表明,價格下跌的風險很低,投資者似乎認爲未來可能出現收入波動。
你應該時刻考慮風險。舉個例子,我們發現了你應該注意的百盛零售亞洲的兩個警告信號。
如果過去盈利增長穩健的公司處於困境,那麼你可能希望看到這些盈利增長強勁、市盈率低的其他公司的免費集合。
對這篇文章有反饋嗎?對內容感到擔憂嗎?請直接聯繫我們。或者,也可以發送電子郵件至編輯團隊 (at) simplywallst.com。
Simply Wall St的這篇文章本質上是籠統的。我們僅使用公正的方法根據歷史數據和分析師的預測提供評論,我們的文章無意作爲財務建議。它不構成買入或賣出任何股票的建議,也沒有考慮到您的目標或財務狀況。我們的目標是爲您提供由基本數據驅動的長期重點分析。請注意,我們的分析可能不考慮最新的價格敏感型公司公告或定性材料。簡而言之,華爾街沒有持有任何上述股票的頭寸。