
Even Though Ultra Clean Holdings (NASDAQ:UCTT) Has Lost US$63m Market Cap in Last 7 Days, Shareholders Are Still up 255% Over 5 Years
Even Though Ultra Clean Holdings (NASDAQ:UCTT) Has Lost US$63m Market Cap in Last 7 Days, Shareholders Are Still up 255% Over 5 Years
The worst result, after buying shares in a company (assuming no leverage), would be if you lose all the money you put in. But on the bright side, if you buy shares in a high quality company at the right price, you can gain well over 100%. For example, the Ultra Clean Holdings, Inc. (NASDAQ:UCTT) share price has soared 255% in the last half decade. Most would be very happy with that. But it's down 3.0% in the last week. But this could be related to the soft market, with stocks selling off around 0.2% in the last week.
買入公司股票後(假定沒有槓桿),最壞的情況是你損失了你投入的所有資金。但從另一方面來看,如果你以正確的價格買入高品質公司的股票,你可以獲得超過100%的收益。例如,Ultra Clean Holdings,Inc.(NASDAQ:UCTT)的股價在過去的五年中飆升了255%。大多數人都非常高興。但在上週下跌了3.0%。但這可能與市場疲軟有關,股票在上週下跌了約0.2%。
While the stock has fallen 3.0% this week, it's worth focusing on the longer term and seeing if the stocks historical returns have been driven by the underlying fundamentals.
雖然本週股價下跌了3.0%,但值得關注的是長期趨勢,並查看股票的歷史回報是否受基本面驅動。
There is no denying that markets are sometimes efficient, but prices do not always reflect underlying business performance. One imperfect but simple way to consider how the market perception of a company has shifted is to compare the change in the earnings per share (EPS) with the share price movement.
不可否認的是,市場有時是高效的,但價格並不總是反映潛在的商業表現。一個不完美但簡單的方法來考慮公司市場感知如何改變是比較每股收益(EPS)變化和股價變動。
During five years of share price growth, Ultra Clean Holdings actually saw its EPS drop 2.7% per year.
在五年的股價增長期間,Ultra Clean Holdings的每股收益實際上下降了2.7%。
By glancing at these numbers, we'd posit that the decline in earnings per share is not representative of how the business has changed over the years. Therefore, it's worth taking a look at other metrics to try to understand the share price movements.
通過瀏覽這些數字,我們可以推斷每股收益下降並不代表業務在這些年裏的變化。因此,值得看看其他指標以了解股票價格的變動。
On the other hand, Ultra Clean Holdings' revenue is growing nicely, at a compound rate of 15% over the last five years. In that case, the company may be sacrificing current earnings per share to drive growth.
另一方面,Ultra Clean Holdings的收入以複合年增長率15%的速度增長,這可能是公司爲推動增長而犧牲當前每股收益。
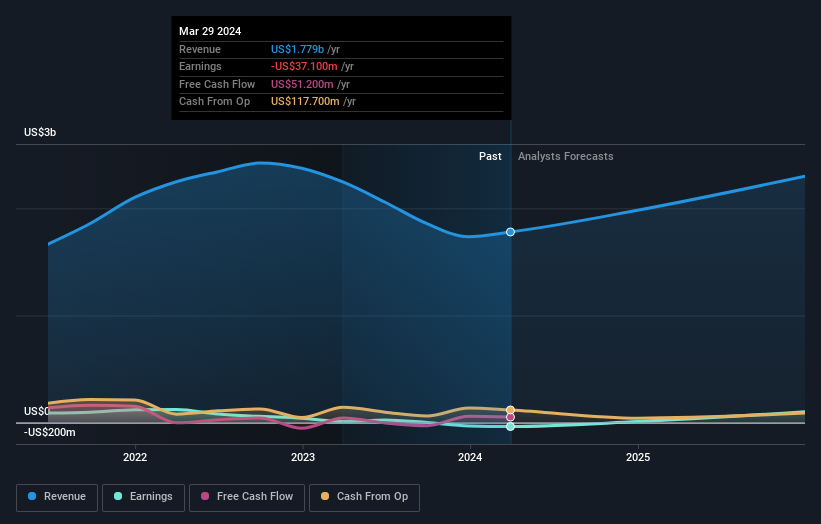
The image below shows how earnings and revenue have tracked over time (if you click on the image you can see greater detail).
下圖顯示了收益和營收隨時間變化的情況(如果你點擊圖像,可以看到更多細節):
You can see how its balance sheet has strengthened (or weakened) over time in this free interactive graphic.
你可以在這個免費的互動圖表中看到它的資產負債表如何隨着時間的推移而加強(或削弱)。
A Different Perspective
不同的觀點
Ultra Clean Holdings provided a TSR of 25% over the last twelve months. But that was short of the market average. It's probably a good sign that the company has an even better long term track record, having provided shareholders with an annual TSR of 29% over five years. Maybe the share price is just taking a breather while the business executes on its growth strategy. I find it very interesting to look at share price over the long term as a proxy for business performance. But to truly gain insight, we need to consider other information, too. Consider risks, for instance. Every company has them, and we've spotted 1 warning sign for Ultra Clean Holdings you should know about.
過去十二個月,Ultra Clean Holdings的股票總回報率爲25%。但仍低於市場平均水平。它可能是一個好跡象,公司擁有更好的長期跟蹤記錄,爲股東提供了每年29%的股票總回報率。也許股票價格僅僅是在休息,而公司在執行其增長策略。我發現長期的股票價格作爲業務表現的代理非常有趣。但是爲了真正獲得洞察力,我們還需要考慮其他信息。例如,考慮風險。每個公司都有自己的風險,我們已經發現Ultra Clean Holdings存在1個警告信號,你應該知道。
But note: Ultra Clean Holdings may not be the best stock to buy. So take a peek at this free list of interesting companies with past earnings growth (and further growth forecast).
但請注意:Ultra Clean Holdings可能不是最好的買入股票。因此,請查看這個自由列表,其中包含過去實現盈利增長(和進一步增長預測)的有趣公司。
Please note, the market returns quoted in this article reflect the market weighted average returns of stocks that currently trade on American exchanges.
請注意,本文所引述的市場回報反映了目前在美國交易所上市的股票的市場加權平均回報。
Have feedback on this article? Concerned about the content? Get in touch with us directly. Alternatively, email editorial-team (at) simplywallst.com.
This article by Simply Wall St is general in nature. We provide commentary based on historical data and analyst forecasts only using an unbiased methodology and our articles are not intended to be financial advice. It does not constitute a recommendation to buy or sell any stock, and does not take account of your objectives, or your financial situation. We aim to bring you long-term focused analysis driven by fundamental data. Note that our analysis may not factor in the latest price-sensitive company announcements or qualitative material. Simply Wall St has no position in any stocks mentioned.
對本文有反饋?關於內容有所顧慮?直接和我們聯繫。或者,發送電子郵件至editorial-team (at) simplywallst.com。
這篇文章是Simply Wall St的一般性文章。我們根據歷史數據和分析師預測提供評論,只使用公正的方法論,我們的文章並不意味着提供任何金融建議。文章不構成買賣任何股票的建議,也不考慮您的目標或您的財務狀況。我們的目標是帶給您基本數據驅動的長期關注分析。請注意,我們的分析可能不考慮最新的價格敏感公司公告或定性材料。Simply Wall St沒有任何股票頭寸。
譯文內容由第三人軟體翻譯。