
The Three-year Shareholder Returns and Company Earnings Persist Lower as CarMax (NYSE:KMX) Stock Falls a Further 6.2% in Past Week
The Three-year Shareholder Returns and Company Earnings Persist Lower as CarMax (NYSE:KMX) Stock Falls a Further 6.2% in Past Week
In order to justify the effort of selecting individual stocks, it's worth striving to beat the returns from a market index fund. But if you try your hand at stock picking, you risk returning less than the market. We regret to report that long term CarMax, Inc. (NYSE:KMX) shareholders have had that experience, with the share price dropping 39% in three years, versus a market return of about 20%. On top of that, the share price is down 6.2% in the last week.
爲了證明選擇個股的努力是值得的,值得努力打敗市場指數基金的回報。但是如果你嘗試股票挑選,則有可能回報低於市場。我們很遺憾地報告說,CarMax, Inc.(NYSE:KMX)長期股東經歷了這種經歷,在三年中股價下跌了39%,而市場回報約爲20%。除此之外,股價在最近一週下跌了6.2%。
After losing 6.2% this past week, it's worth investigating the company's fundamentals to see what we can infer from past performance.
在過去的一週中下跌了6.2%後,值得研究公司的基本面,以了解我們可以從過去的表現中推斷出什麼。
To quote Buffett, 'Ships will sail around the world but the Flat Earth Society will flourish. There will continue to be wide discrepancies between price and value in the marketplace...' One imperfect but simple way to consider how the market perception of a company has shifted is to compare the change in the earnings per share (EPS) with the share price movement.
引用巴菲特的話:“船隻將周遊世界,而‘地平派’仍會興旺。市場上的價格和價值仍會存在廣泛的差距……”考慮一家公司在市場上的認知如何變化的一個不完美但簡單的方法是比較每股收益(EPS)的變化和股價的波動。
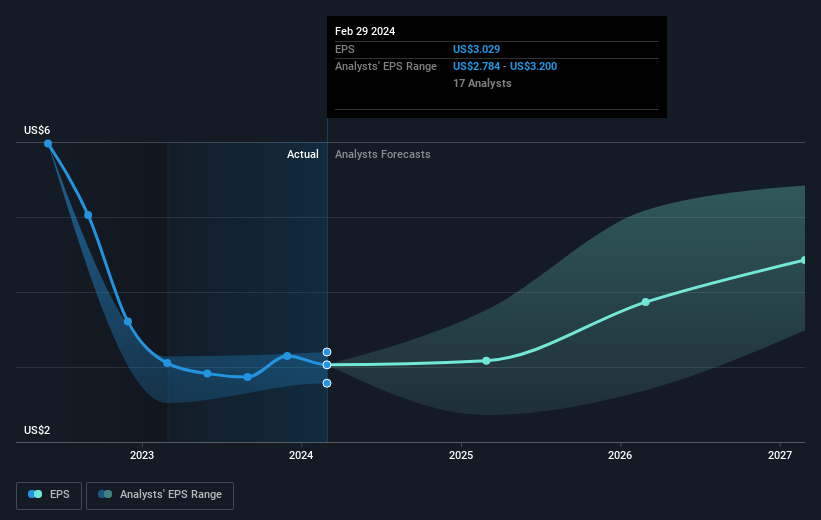
CarMax saw its EPS decline at a compound rate of 13% per year, over the last three years. This change in EPS is reasonably close to the 15% average annual decrease in the share price. That suggests that the market sentiment around the company hasn't changed much over that time, despite the disappointment. In this case, it seems that the EPS is guiding the share price.
CarMax在過去三年中,每股收益年複合下降13%。這種EPS變化與股價每年平均下降15%相當接近。這表明儘管有失望,但公司周圍的市場情緒沒有多大變化。在這種情況下,EPS似乎指導着股價。
The image below shows how EPS has tracked over time (if you click on the image you can see greater detail).
下圖顯示了EPS隨時間的變化情況(如果您單擊該圖像,則可以查看更多詳細信息)。
This free interactive report on CarMax's earnings, revenue and cash flow is a great place to start, if you want to investigate the stock further.
如果您想進一步調查該股票,請參閱有關CarMax收益,營業收入和現金流量的免費互動報告,這是一個很好的起點。
A Different Perspective
不同的觀點
CarMax shareholders are down 0.6% for the year, but the market itself is up 30%. Even the share prices of good stocks drop sometimes, but we want to see improvements in the fundamental metrics of a business, before getting too interested. However, the loss over the last year isn't as bad as the 1.8% per annum loss investors have suffered over the last half decade. We'd need to see some sustained improvements in the key metrics before we could muster much enthusiasm. While it is well worth considering the different impacts that market conditions can have on the share price, there are other factors that are even more important. For example, we've discovered 1 warning sign for CarMax that you should be aware of before investing here.
CarMax的股東今年虧損了0.6%,但市場本身上漲了30%。即使好股票的股價有時會下跌,但在對公司的基本指標看到改善之前,我們希望看到基金改善。然而,去年的損失並不像投資者在過去五年中每年蒙受的1.8%的損失那麼糟糕。在我們產生太多熱情之前,我們需要看到一些關鍵指標的持續改善。雖然考慮市場條件對股價產生的不同影響非常值得,但還有其他更重要的因素。例如,我們發現了CarMax的1個警告信號,您應該在此投資之前了解。
If you would prefer to check out another company -- one with potentially superior financials -- then do not miss this free list of companies that have proven they can grow earnings.
如果您願意查看另一家公司-具有潛在更優質財務狀況的公司-則不要錯過這個免費的公司列表,這些公司已經證明他們可以增長收益。
Please note, the market returns quoted in this article reflect the market weighted average returns of stocks that currently trade on American exchanges.
請注意,本文所引述的市場回報反映了目前在美國交易所上市的股票的市場加權平均回報。
Have feedback on this article? Concerned about the content? Get in touch with us directly. Alternatively, email editorial-team (at) simplywallst.com.
This article by Simply Wall St is general in nature. We provide commentary based on historical data and analyst forecasts only using an unbiased methodology and our articles are not intended to be financial advice. It does not constitute a recommendation to buy or sell any stock, and does not take account of your objectives, or your financial situation. We aim to bring you long-term focused analysis driven by fundamental data. Note that our analysis may not factor in the latest price-sensitive company announcements or qualitative material. Simply Wall St has no position in any stocks mentioned.
對本文有反饋?關於內容有所顧慮?直接和我們聯繫。或者,發送電子郵件至editorial-team (at) simplywallst.com。
這篇文章是Simply Wall St的一般性文章。我們根據歷史數據和分析師預測提供評論,只使用公正的方法論,我們的文章並不意味着提供任何金融建議。文章不構成買賣任何股票的建議,也不考慮您的目標或您的財務狀況。我們的目標是帶給您基本數據驅動的長期關注分析。請注意,我們的分析可能不考慮最新的價格敏感公司公告或定性材料。Simply Wall St沒有任何股票頭寸。
譯文內容由第三人軟體翻譯。