
ReNew Energy Global (NASDAQ:RNW) Will Be Hoping To Turn Its Returns On Capital Around
ReNew Energy Global (NASDAQ:RNW) Will Be Hoping To Turn Its Returns On Capital Around
To find a multi-bagger stock, what are the underlying trends we should look for in a business? One common approach is to try and find a company with returns on capital employed (ROCE) that are increasing, in conjunction with a growing amount of capital employed. This shows us that it's a compounding machine, able to continually reinvest its earnings back into the business and generate higher returns. Although, when we looked at ReNew Energy Global (NASDAQ:RNW), it didn't seem to tick all of these boxes.
要找到一隻多袋裝箱的股票,我們應該在企業中尋找哪些潛在趨勢?一種常見的方法是嘗試找一家公司 回報 論資本使用率(ROCE)在增加的同時增長 金額 所用資本的比例。這向我們表明,它是一臺複合機器,能夠持續將其收益再投資到業務中併產生更高的回報。但是,當我們查看ReneW Energy Global(納斯達克股票代碼:RNW)時,它似乎並沒有勾選所有這些方框。
Understanding Return On Capital Employed (ROCE)
了解資本使用回報率 (ROCE)
For those that aren't sure what ROCE is, it measures the amount of pre-tax profits a company can generate from the capital employed in its business. Analysts use this formula to calculate it for ReNew Energy Global:
對於那些不確定ROCE是什麼的人,它衡量的是公司從其業務中使用的資本中可以產生的稅前利潤金額。分析師使用這個公式來計算 ReneW Energy Global 的值:
Return on Capital Employed = Earnings Before Interest and Tax (EBIT) ÷ (Total Assets - Current Liabilities)
已動用資本回報率 = 息稅前收益 (EBIT) ¥(總資產-流動負債)
0.06 = ₹43b ÷ (₹887b - ₹165b) (Based on the trailing twelve months to December 2023).
0.06 = 430億盧比 ÷(887億盧比-165億盧比) (基於截至2023年12月的過去十二個月)。
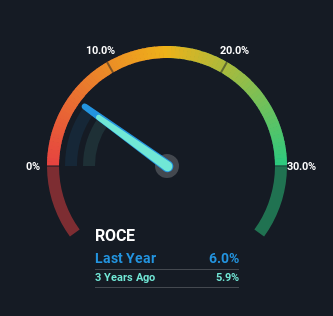
So, ReNew Energy Global has an ROCE of 6.0%. On its own, that's a low figure but it's around the 5.5% average generated by the Renewable Energy industry.
因此,ReneW Energy Global的投資回報率爲6.0%。就其本身而言,這是一個很低的數字,但約爲可再生能源行業產生的平均5.5%。
In the above chart we have measured ReNew Energy Global's prior ROCE against its prior performance, but the future is arguably more important. If you'd like, you can check out the forecasts from the analysts covering ReNew Energy Global for free.
在上圖中,我們將Renew Energy Global先前的投資回報率與之前的表現進行了比較,但可以說,未來更爲重要。如果你願意,你可以免費查看報道Renew Energy Global的分析師的預測。
How Are Returns Trending?
退貨趨勢如何?
When we looked at the ROCE trend at ReNew Energy Global, we didn't gain much confidence. Around five years ago the returns on capital were 7.6%, but since then they've fallen to 6.0%. Although, given both revenue and the amount of assets employed in the business have increased, it could suggest the company is investing in growth, and the extra capital has led to a short-term reduction in ROCE. If these investments prove successful, this can bode very well for long term stock performance.
當我們研究Renew Energy Global的投資回報率趨勢時,我們並沒有獲得太大的信心。大約五年前,資本回報率爲7.6%,但此後已降至6.0%。儘管考慮到該業務的收入和資產數量都有所增加,但這可能表明該公司正在投資增長,而額外的資本導致了投資回報率的短期下降。如果這些投資被證明是成功的,這對長期股票表現來說是個好兆頭。
The Bottom Line
底線
In summary, despite lower returns in the short term, we're encouraged to see that ReNew Energy Global is reinvesting for growth and has higher sales as a result. These growth trends haven't led to growth returns though, since the stock has fallen 39% over the last three years. So we think it'd be worthwhile to look further into this stock given the trends look encouraging.
總而言之,儘管短期內回報較低,但令我們感到鼓舞的是,Renew Energy Global正在進行再投資以實現增長,從而提高了銷售額。但是,這些增長趨勢並未帶來增長回報,因爲該股在過去三年中下跌了39%。因此,鑑於趨勢令人鼓舞,我們認爲值得進一步研究該股。
ReNew Energy Global does have some risks, we noticed 2 warning signs (and 1 which is a bit concerning) we think you should know about.
Renew Energy Global確實存在一些風險,我們注意到兩個警告信號(還有一個有點令人擔憂),我們認爲你應該知道。
While ReNew Energy Global isn't earning the highest return, check out this free list of companies that are earning high returns on equity with solid balance sheets.
儘管Renew Energy Global的回報率並不高,但請查看這份免費的股票回報率高、資產負債表穩健的公司名單。
Have feedback on this article? Concerned about the content? Get in touch with us directly. Alternatively, email editorial-team (at) simplywallst.com.
This article by Simply Wall St is general in nature. We provide commentary based on historical data and analyst forecasts only using an unbiased methodology and our articles are not intended to be financial advice. It does not constitute a recommendation to buy or sell any stock, and does not take account of your objectives, or your financial situation. We aim to bring you long-term focused analysis driven by fundamental data. Note that our analysis may not factor in the latest price-sensitive company announcements or qualitative material. Simply Wall St has no position in any stocks mentioned.
對這篇文章有反饋嗎?對內容感到擔憂?直接聯繫我們。 或者,給編輯團隊 (at) simplywallst.com 發送電子郵件。
Simply Wall St的這篇文章本質上是籠統的。我們僅使用公正的方法根據歷史數據和分析師的預測提供評論,我們的文章無意作爲財務建議。它不構成買入或賣出任何股票的建議,也沒有考慮到您的目標或財務狀況。我們的目標是爲您提供由基本數據驅動的長期重點分析。請注意,我們的分析可能不考慮最新的價格敏感型公司公告或定性材料。簡而言之,華爾街沒有持有任何上述股票的頭寸。
譯文內容由第三人軟體翻譯。