
Investors in Skechers U.S.A (NYSE:SKX) Have Seen Solid Returns of 142% Over the Past Five Years
Investors in Skechers U.S.A (NYSE:SKX) Have Seen Solid Returns of 142% Over the Past Five Years
When you buy a stock there is always a possibility that it could drop 100%. But on the bright side, you can make far more than 100% on a really good stock. One great example is Skechers U.S.A., Inc. (NYSE:SKX) which saw its share price drive 142% higher over five years. It's also up 21% in about a month. This could be related to the recent financial results that were recently released - you could check the most recent data by reading our company report.
當你買入股票時,它總是有可能下跌100%。但好的一面是,購買一隻非常好的股票,您可以賺取超過100%的收入。一個很好的例子是斯凱奇美國公司(紐約證券交易所代碼:SKX),其股價在五年內上漲了142%。它在大約一個月內也上漲了21%。這可能與最近發佈的最新財務業績有關——你可以通過閱讀我們的公司報告來查看最新的數據。
With that in mind, it's worth seeing if the company's underlying fundamentals have been the driver of long term performance, or if there are some discrepancies.
考慮到這一點,值得一看公司的基本面是否是長期業績的驅動力,或者是否存在一些差異。
There is no denying that markets are sometimes efficient, but prices do not always reflect underlying business performance. By comparing earnings per share (EPS) and share price changes over time, we can get a feel for how investor attitudes to a company have morphed over time.
不可否認,市場有時是有效的,但價格並不總是能反映潛在的業務表現。通過比較每股收益(EPS)和一段時間內的股價變化,我們可以了解投資者對公司的態度是如何隨着時間的推移而變化的。
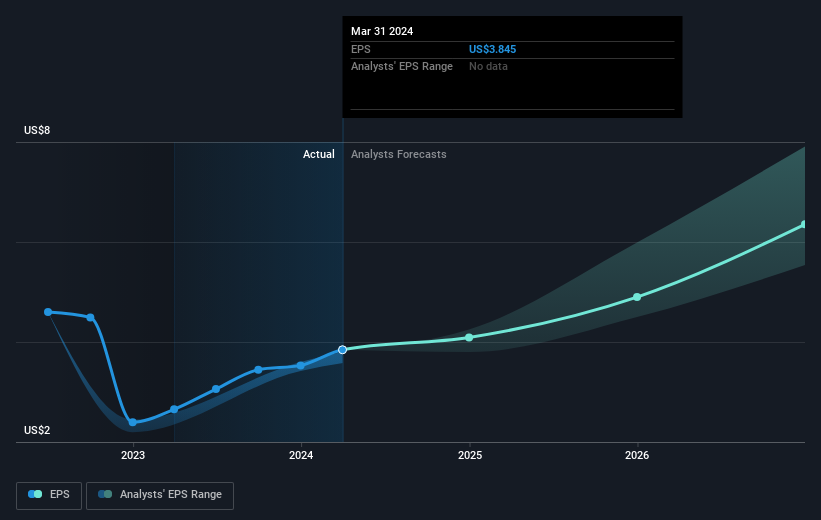
Over half a decade, Skechers U.S.A managed to grow its earnings per share at 16% a year. So the EPS growth rate is rather close to the annualized share price gain of 19% per year. That suggests that the market sentiment around the company hasn't changed much over that time. In fact, the share price seems to largely reflect the EPS growth.
在過去的五年中,美國斯凱奇設法將其每股收益增長到每年16%。因此,每股收益的增長率相當接近每年19%的年化股價漲幅。這表明,在那段時間內,公司周圍的市場情緒沒有太大變化。實際上,股價似乎在很大程度上反映了每股收益的增長。
You can see below how EPS has changed over time (discover the exact values by clicking on the image).
你可以在下面看到 EPS 是如何隨着時間的推移而變化的(點擊圖片發現確切的值)。
We consider it positive that insiders have made significant purchases in the last year. Having said that, most people consider earnings and revenue growth trends to be a more meaningful guide to the business. It might be well worthwhile taking a look at our free report on Skechers U.S.A's earnings, revenue and cash flow.
我們認爲,內部人士在去年進行了大量收購,這是積極的。話雖如此,大多數人認爲收益和收入增長趨勢是更有意義的業務指南。可能值得一看我們關於美國斯凱奇收益、收入和現金流的免費報告。
A Different Perspective
不同的視角
It's good to see that Skechers U.S.A has rewarded shareholders with a total shareholder return of 34% in the last twelve months. That's better than the annualised return of 19% over half a decade, implying that the company is doing better recently. Given the share price momentum remains strong, it might be worth taking a closer look at the stock, lest you miss an opportunity. It's always interesting to track share price performance over the longer term. But to understand Skechers U.S.A better, we need to consider many other factors. Consider risks, for instance. Every company has them, and we've spotted 1 warning sign for Skechers U.S.A you should know about.
很高興看到斯凱奇美國公司在過去十二個月中向股東提供了34%的總股東回報率。這比五年來19%的年化回報率要好,這意味着該公司最近的表現更好。鑑於股價勢頭仍然強勁,可能值得仔細研究該股,以免錯過機會。長期跟蹤股價表現總是很有意思的。但是,爲了更好地了解美國斯凱奇,我們需要考慮許多其他因素。例如,考慮風險。每家公司都有它們,我們發現了一個你應該知道的美國斯凱奇警告標誌。
Skechers U.S.A is not the only stock insiders are buying. So take a peek at this free list of small cap companies at attractive valuations which insiders have been buying.
斯凱奇美國並不是內部人士唯一買入的股票。因此,看看這份內部人士一直在購買的估值誘人的小盤股公司的免費清單。
Please note, the market returns quoted in this article reflect the market weighted average returns of stocks that currently trade on American exchanges.
請注意,本文引用的市場回報反映了目前在美國交易所交易的股票的市場加權平均回報。
Have feedback on this article? Concerned about the content? Get in touch with us directly. Alternatively, email editorial-team (at) simplywallst.com.
This article by Simply Wall St is general in nature. We provide commentary based on historical data and analyst forecasts only using an unbiased methodology and our articles are not intended to be financial advice. It does not constitute a recommendation to buy or sell any stock, and does not take account of your objectives, or your financial situation. We aim to bring you long-term focused analysis driven by fundamental data. Note that our analysis may not factor in the latest price-sensitive company announcements or qualitative material. Simply Wall St has no position in any stocks mentioned.
對這篇文章有反饋嗎?對內容感到擔憂?直接聯繫我們。 或者,給編輯團隊 (at) simplywallst.com 發送電子郵件。
Simply Wall St的這篇文章本質上是籠統的。我們僅使用公正的方法根據歷史數據和分析師的預測提供評論,我們的文章無意作爲財務建議。它不構成買入或賣出任何股票的建議,也沒有考慮到您的目標或財務狀況。我們的目標是爲您提供由基本數據驅動的長期重點分析。請注意,我們的分析可能不考慮最新的價格敏感型公司公告或定性材料。簡而言之,華爾街沒有持有任何上述股票的頭寸。
譯文內容由第三人軟體翻譯。