
 Yahoo Finance
 Do Its Financials Have Any Role To Play In Driving JD.com, Inc.'s (NASDAQ:JD) Stock Up Recently?
JD.com (NASDAQ:JD) has had a great run on the share market with its stock up by a significant 50% over the last three months. Given that stock prices are usually aligned with a company's financial performance in the long-term, we decided to study its financial indicators more closely to see if they had a hand to play in the recent price move. Particularly, we will be paying attention to JD.com's ROE today.
Return on Equity or ROE is a test of how effectively a company is growing its value and managing investors’ money. Simply put, it is used to assess the profitability of a company in relation to its equity capital.
Check out our latest analysis for JD.com
How Is ROE Calculated?
The formula for return on equity is:
Return on Equity = Net Profit (from continuing operations) ÷ Shareholders' Equity
So, based on the above formula, the ROE for JD.com is:
8.5% = CN¥24b ÷ CN¥288b (Based on the trailing twelve months to March 2024).
The 'return' is the profit over the last twelve months. One way to conceptualize this is that for each $1 of shareholders' capital it has, the company made $0.08 in profit.
What Is The Relationship Between ROE And Earnings Growth?
So far, we've learned that ROE is a measure of a company's profitability. We now need to evaluate how much profit the company reinvests or "retains" for future growth which then gives us an idea about the growth potential of the company. Assuming all else is equal, companies that have both a higher return on equity and higher profit retention are usually the ones that have a higher growth rate when compared to companies that don't have the same features.
JD.com's Earnings Growth And 8.5% ROE
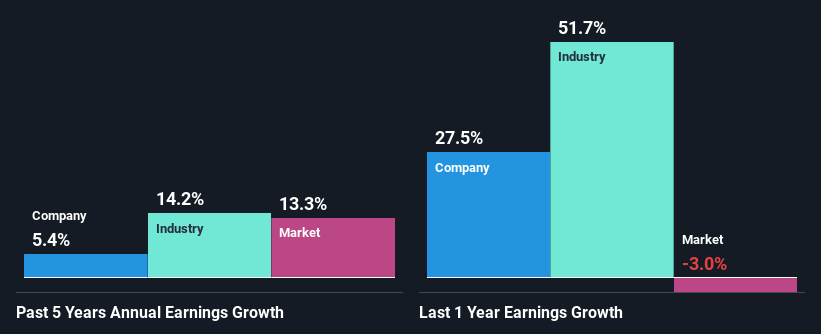
On the face of it, JD.com's ROE is not much to talk about. Next, when compared to the average industry ROE of 17%, the company's ROE leaves us feeling even less enthusiastic. JD.com was still able to see a decent net income growth of 5.4% over the past five years. So, the growth in the company's earnings could probably have been caused by other variables. For example, it is possible that the company's management has made some good strategic decisions, or that the company has a low payout ratio.
We then compared JD.com's net income growth with the industry and found that the company's growth figure is lower than the average industry growth rate of 14% in the same 5-year period, which is a bit concerning.
The basis for attaching value to a company is, to a great extent, tied to its earnings growth. The investor should try to establish if the expected growth or decline in earnings, whichever the case may be, is priced in. Doing so will help them establish if the stock's future looks promising or ominous. Has the market priced in the future outlook for JD? You can find out in our latest intrinsic value infographic research report.
Is JD.com Making Efficient Use Of Its Profits?
JD.com has a healthy combination of a moderate three-year median payout ratio of 34% (or a retention ratio of 66%) and a respectable amount of growth in earnings as we saw above, meaning that the company has been making efficient use of its profits.
While JD.com has seen growth in its earnings, it only recently started to pay a dividend. It is most likely that the company decided to impress new and existing shareholders with a dividend. Our latest analyst data shows that the future payout ratio of the company is expected to drop to 22% over the next three years. As a result, the expected drop in JD.com's payout ratio explains the anticipated rise in the company's future ROE to 13%, over the same period.
Summary
Overall, we feel that JD.com certainly does have some positive factors to consider. Namely, its respectable earnings growth, which it achieved due to it retaining most of its profits. However, given the low ROE, investors may not be benefitting from all that reinvestment after all. Having said that, looking at the current analyst estimates, we found that the company's earnings are expected to gain momentum. To know more about the company's future earnings growth forecasts take a look at this free report on analyst forecasts for the company to find out more.
Have feedback on this article? Concerned about the content? Get in touch with us directly. Alternatively, email editorial-team (at) simplywallst.com.
This article by Simply Wall St is general in nature. We provide commentary based on historical data and analyst forecasts only using an unbiased methodology and our articles are not intended to be financial advice. It does not constitute a recommendation to buy or sell any stock, and does not take account of your objectives, or your financial situation. We aim to bring you long-term focused analysis driven by fundamental data. Note that our analysis may not factor in the latest price-sensitive company announcements or qualitative material. Simply Wall St has no position in any stocks mentioned.
