
The Three-year Underlying Earnings Growth at LBX Pharmacy Chain (SHSE:603883) Is Promising, but the Shareholders Are Still in the Red Over That Time
The Three-year Underlying Earnings Growth at LBX Pharmacy Chain (SHSE:603883) Is Promising, but the Shareholders Are Still in the Red Over That Time
While it may not be enough for some shareholders, we think it is good to see the LBX Pharmacy Chain Joint Stock Company (SHSE:603883) share price up 11% in a single quarter. It's not great that the stock is down over the last three years. But that's not so bad when you consider its market is down 16%.
雖然這可能不足以滿足一些股東的需求,但我們認爲,在單個季度內,LBX Pharmacy Chain Joint Stock Company (SHSE:603883) 的股票價格上漲了11%是一個好兆頭。 過去三年股票下跌並不是很好的情況。 但考慮到其市場下跌了16%,這並不是那麼糟糕。
After losing 4.3% this past week, it's worth investigating the company's fundamentals to see what we can infer from past performance.
在上週下跌4.3%後,值得調查公司的基本面,以查看我們可以從過去的表現中推斷出什麼。
To paraphrase Benjamin Graham: Over the short term the market is a voting machine, but over the long term it's a weighing machine. One imperfect but simple way to consider how the market perception of a company has shifted is to compare the change in the earnings per share (EPS) with the share price movement.
爲了概述本傑明·格雷厄姆(Benjamin Graham)的話:短期內,市場是一臺投票機,但長期來看,它是一臺衡重機。思考一家公司的市場感知如何轉變的一種不完美但簡單的方法是將每股收益(EPS)變化與股價變動進行比較。
During the unfortunate three years of share price decline, LBX Pharmacy Chain actually saw its earnings per share (EPS) improve by 10% per year. This is quite a puzzle, and suggests there might be something temporarily buoying the share price. Or else the company was over-hyped in the past, and so its growth has disappointed.
在股票價格下跌的三年中,LBX Pharmacy Chain的每股收益(EPS)實際上每年增長了10%。 這是一個相當棘手的問題,表明可能存在一些暫時支撐股票價格的因素。或者公司在過去被過度炒作,因此其增長已經讓人失望。
Since the change in EPS doesn't seem to correlate with the change in share price, it's worth taking a look at other metrics.
由於EPS的變化似乎與股價的變化不相關,因此值得查看其他指標。
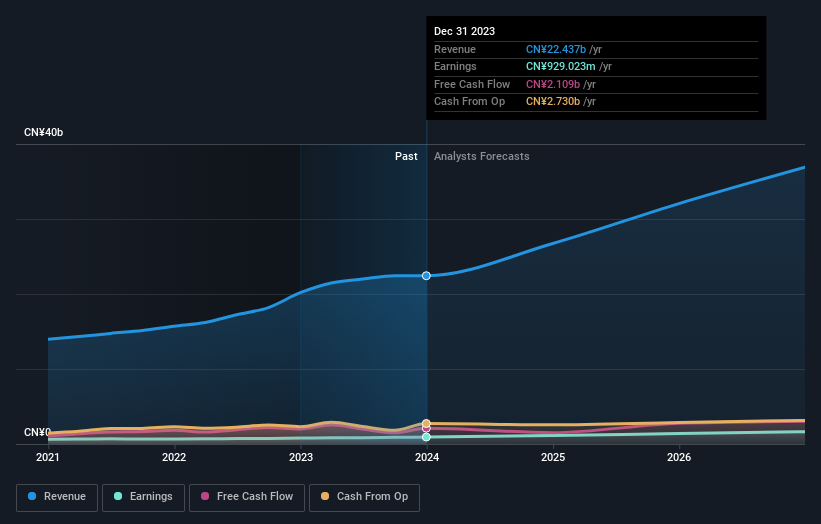
With a rather small yield of just 1.5% we doubt that the stock's share price is based on its dividend. Revenue is actually up 18% over the three years, so the share price drop doesn't seem to hinge on revenue, either. This analysis is just perfunctory, but it might be worth researching LBX Pharmacy Chain more closely, as sometimes stocks fall unfairly. This could present an opportunity.
由於債券收益率僅有1.5%,我們懷疑該股票的股價並非基於其股息。 營業收入實際上在過去三年中上漲18%,因此股價下跌似乎也不依賴於營業收入。 雖然這只是一項例行分析,但更仔細地研究LBX Pharmacy Chain可能是值得的,因爲有時股票下跌是不公平的。 這可能會帶來機會。
The image below shows how earnings and revenue have tracked over time (if you click on the image you can see greater detail).
下圖顯示了收益和營收隨時間變化的情況(如果你點擊圖像,可以看到更多細節):
LBX Pharmacy Chain is well known by investors, and plenty of clever analysts have tried to predict the future profit levels. So it makes a lot of sense to check out what analysts think LBX Pharmacy Chain will earn in the future (free analyst consensus estimates)
LBX Pharmacy Chain 很受投資者的歡迎,聰明的分析師也嘗試預測未來的盈利水平。 因此,檢查分析師對LBX Pharmacy Chain未來收益的預測(免費的分析師共識預測)是非常明智的選擇。
What About Dividends?
那麼分紅怎麼樣呢?
As well as measuring the share price return, investors should also consider the total shareholder return (TSR). The TSR incorporates the value of any spin-offs or discounted capital raisings, along with any dividends, based on the assumption that the dividends are reinvested. So for companies that pay a generous dividend, the TSR is often a lot higher than the share price return. As it happens, LBX Pharmacy Chain's TSR for the last 3 years was -14%, which exceeds the share price return mentioned earlier. The dividends paid by the company have thusly boosted the total shareholder return.
除了衡量股票回報率外,投資者還應考慮總股東回報率(TSR)。 TSR包括任何分拆或折價融資的價值,以及基於股息再投資的任何股息,假設股息再投資。 因此,對於支付慷慨的股息的公司,TSR通常比股票回報率高得多。 LBX Pharmacy Chain在過去3年的TSR爲-14%,超過了前面提到的股票回報率。 公司支付的股息因此提高了總股東回報。
A Different Perspective
不同的觀點
It's good to see that LBX Pharmacy Chain has rewarded shareholders with a total shareholder return of 3.6% in the last twelve months. Of course, that includes the dividend. That gain is better than the annual TSR over five years, which is 1.6%. Therefore it seems like sentiment around the company has been positive lately. Someone with an optimistic perspective could view the recent improvement in TSR as indicating that the business itself is getting better with time. It's always interesting to track share price performance over the longer term. But to understand LBX Pharmacy Chain better, we need to consider many other factors. For example, we've discovered 1 warning sign for LBX Pharmacy Chain that you should be aware of before investing here.
很高興看到LBX Pharmacy Chain在過去12個月裏以3.6%的總股東回報(當然包括股息)回報股東。 當然,這還包括股息。 那種收益比5年的年度TSR(1.6%)要好。 因此,看起來近來市場對這家公司的情緒很好。 一個持樂觀態度的人可以將最近TSR的改善視爲表明企業本身隨着時間的推移正在變得更好的跡象。 長期跟蹤股票表現始終是有趣的。 但爲了更好地了解LBX Pharmacy Chain,我們需要考慮許多其他因素。 例如,我們已經發現了1個LBX Pharmacy Chain的警告信號,您應該在投資之前了解。
We will like LBX Pharmacy Chain better if we see some big insider buys. While we wait, check out this free list of undervalued stocks (mostly small caps) with considerable, recent, insider buying.
如果我們看到一些內部大量購買的情況,我們會更喜歡LBX Pharmacy Chain。 在等待的同時,可以查看這個自由的被低估的股票列表(主要是小市值股票),其中含有相當的,最近的,內部購買。
Please note, the market returns quoted in this article reflect the market weighted average returns of stocks that currently trade on Chinese exchanges.
請注意,本文引用的市場回報反映了目前在中國交易所上市的股票的市場加權平均回報。
Have feedback on this article? Concerned about the content? Get in touch with us directly. Alternatively, email editorial-team (at) simplywallst.com.
This article by Simply Wall St is general in nature. We provide commentary based on historical data and analyst forecasts only using an unbiased methodology and our articles are not intended to be financial advice. It does not constitute a recommendation to buy or sell any stock, and does not take account of your objectives, or your financial situation. We aim to bring you long-term focused analysis driven by fundamental data. Note that our analysis may not factor in the latest price-sensitive company announcements or qualitative material. Simply Wall St has no position in any stocks mentioned.
對本文有反饋?關於內容有所顧慮?直接和我們聯繫。或者,發送電子郵件至editorial-team (at) simplywallst.com。
這篇文章是Simply Wall St的一般性文章。我們根據歷史數據和分析師預測提供評論,只使用公正的方法論,我們的文章並不意味着提供任何金融建議。文章不構成買賣任何股票的建議,也不考慮您的目標或您的財務狀況。我們的目標是帶給您基本數據驅動的長期關注分析。請注意,我們的分析可能不考慮最新的價格敏感公司公告或定性材料。Simply Wall St沒有任何股票頭寸。
譯文內容由第三人軟體翻譯。