Texas Instruments Inc., (TXN) Daily Chart
TXN Elliott Wave technical analysis
Function: Trend.
Mode: Impulsive.
Structure: Motive.
Position: Minute {iii} or 3.
Direction: Upside in {iii}.
Details: Moving as expected, looking for at least equality of 3 vs 1, as we could turn into an ABC and many times equality of C vs. A is a common target.
TXN Elliott Wave technical analysis – Daily chart
Texas Instruments (TXN) is moving as expected within the impulsive wave structure. We are looking for at least equality of wave 3 vs. wave 1. This movement could potentially turn into an ABC pattern, as equality of wave C vs. wave A is a common target in corrective waves.

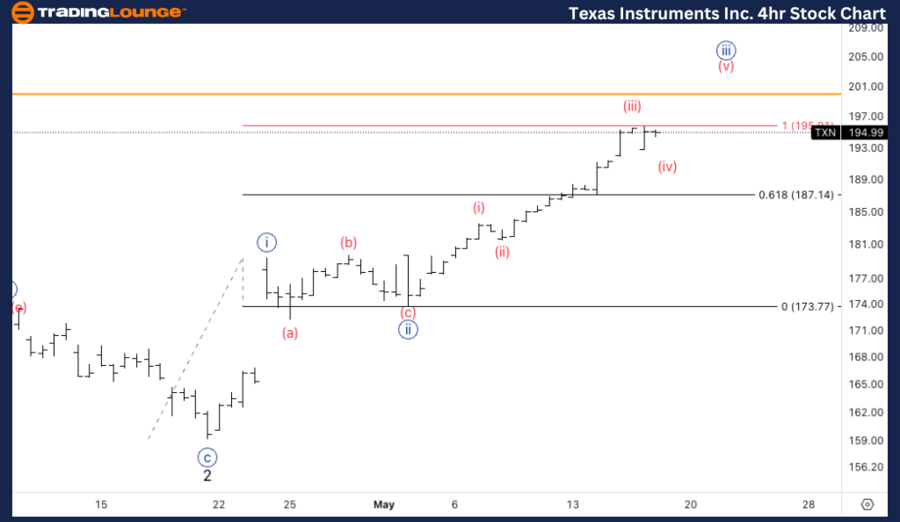
TXN Elliott Wave four-hour chart
In the 4-hour chart, TXN is progressing within wave (v) of {iii}. Currently, the stock is at the equality level of wave {iii} vs. wave {i}. We are looking for this equality to turn into a support level, which would further confirm the bullish trend.
Function: Trend.
Mode: Impulsive.
Structure: Motive.
Position: Minute (iii) of {iii}.
Direction: Upside in {iii}.
Details: Looking for upside into wave (v) of {iii}, we seem to be at equality of {iii] vs. {i}, looking for equality to turn into support.
Discover the latest Elliott Wave analysis for Texas Instruments (TXN) as of May 17, 2024. Learn about key support and resistance levels, and potential price targets for TXN stock.
TXN Elliott Wave technical analysis [Video]
As with any investment opportunity there is a risk of making losses on investments that Trading Lounge expresses opinions on.
Historical results are no guarantee of future returns. Some investments are inherently riskier than others. At worst, you could lose your entire investment. TradingLounge™ uses a range of technical analysis tools, software and basic fundamental analysis as well as economic forecasts aimed at minimizing the potential for loss.
The advice we provide through our TradingLounge™ websites and our TradingLounge™ Membership has been prepared without considering your objectives, financial situation or needs. Reliance on such advice, information or data is at your own risk. The decision to trade and the method of trading is for you alone to decide. This information is of a general nature only, so you should, before acting upon any of the information or advice provided by us, consider the appropriateness of the advice considering your own objectives, financial situation or needs. Therefore, you should consult your financial advisor or accountant to determine whether trading in securities and derivatives products is appropriate for you considering your financial circumstances.
Recommended content
Editors’ Picks
EUR/USD clings to gains above 1.0850 after US inflation data

EUR/USD trades in positive territory above 1.0850 in the American session on Friday. The US Dollar struggles to preserve its strength following the April PCE inflation data and helps the pair hold its ground heading into the weekend.
GBP/USD retreats from 1.2765, holds on to modest gains

GBP/USD posted a two-day high peat at 1.2765 in the American session, as US data showed that the core PCE inflation held steady at 2.8% on a yearly basis in April. The pair retreated afterwards as risk aversion triggered US Dollar demand.
Gold falls towards $2,330 as the mood sours

US inflation-related data took its toll on financial markets. Wall Street turned south after the opening and without signs of easing price pressures in the world’s largest economy. The US Dollar takes the lead in a risk-averse environment.
Here’s why Chainlink price could crash 15% despite spike in social volume Premium

Chainlink price has flashed multiple sell signals after its recent climb, hinting at a short-term correction. This signal comes despite a double-digit growth in its social volume. LINK bulls need to exercise caution as this forecast is backed by on-chain metrics.
Week ahead – ECB rate cut might get eclipsed by BoC surprise and NFP report

ECB set to slash rates on Thursday, focus on forward guidance. But will the BoC take the lead when it meets on Wednesday? US jobs report eyed on Friday as Fed unyielding on cuts. OPEC+ might extend some output reductions into 2025.