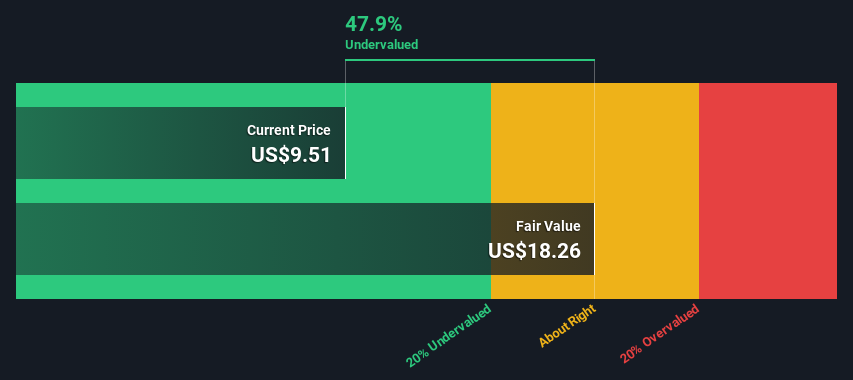
The projected fair value for Hillman Solutions is US$18.26 based on 2 Stage Free Cash Flow to Equity
Hillman Solutions is estimated to be 48% undervalued based on current share price of US$9.51
Analyst price target for HLMN is US$12.00 which is 34% below our fair value estimate
In this article we are going to estimate the intrinsic value of Hillman Solutions Corp. (NASDAQ:HLMN) by taking the expected future cash flows and discounting them to their present value. We will use the Discounted Cash Flow (DCF) model on this occasion. Believe it or not, it's not too difficult to follow, as you'll see from our example!
We would caution that there are many ways of valuing a company and, like the DCF, each technique has advantages and disadvantages in certain scenarios. For those who are keen learners of equity analysis, the Simply Wall St analysis model here may be something of interest to you.
Crunching The Numbers
We use what is known as a 2-stage model, which simply means we have two different periods of growth rates for the company's cash flows. Generally the first stage is higher growth, and the second stage is a lower growth phase. In the first stage we need to estimate the cash flows to the business over the next ten years. Where possible we use analyst estimates, but when these aren't available we extrapolate the previous free cash flow (FCF) from the last estimate or reported value. We assume companies with shrinking free cash flow will slow their rate of shrinkage, and that companies with growing free cash flow will see their growth rate slow, over this period. We do this to reflect that growth tends to slow more in the early years than it does in later years.
A DCF is all about the idea that a dollar in the future is less valuable than a dollar today, so we discount the value of these future cash flows to their estimated value in today's dollars:
10-year free cash flow (FCF) estimate
2024
2025
2026
2027
2028
2029
2030
2031
2032
2033
Levered FCF ($, Millions)
US$104.7m
US$117.8m
US$148.1m
US$182.5m
US$211.5m
US$233.0m
US$251.3m
US$266.9m
US$280.3m
US$292.3m
Growth Rate Estimate Source
Analyst x3
Analyst x5
Analyst x3
Analyst x2
Analyst x2
Est @ 10.17%
Est @ 7.84%
Est @ 6.20%
Est @ 5.05%
Est @ 4.25%
Present Value ($, Millions) Discounted @ 8.3%
US$96.7
US$101
US$117
US$133
US$142
US$145
US$144
US$141
US$137
US$132
("Est" = FCF growth rate estimated by Simply Wall St) Present Value of 10-year Cash Flow (PVCF) = US$1.3b
We now need to calculate the Terminal Value, which accounts for all the future cash flows after this ten year period. The Gordon Growth formula is used to calculate Terminal Value at a future annual growth rate equal to the 5-year average of the 10-year government bond yield of 2.4%. We discount the terminal cash flows to today's value at a cost of equity of 8.3%.
Present Value of Terminal Value (PVTV)= TV / (1 + r)10= US$5.1b÷ ( 1 + 8.3%)10= US$2.3b
The total value, or equity value, is then the sum of the present value of the future cash flows, which in this case is US$3.6b. In the final step we divide the equity value by the number of shares outstanding. Compared to the current share price of US$9.5, the company appears quite undervalued at a 48% discount to where the stock price trades currently. The assumptions in any calculation have a big impact on the valuation, so it is better to view this as a rough estimate, not precise down to the last cent.
NasdaqGM:HLMN Discounted Cash Flow May 14th 2024
Important Assumptions
Now the most important inputs to a discounted cash flow are the discount rate, and of course, the actual cash flows. If you don't agree with these result, have a go at the calculation yourself and play with the assumptions. The DCF also does not consider the possible cyclicality of an industry, or a company's future capital requirements, so it does not give a full picture of a company's potential performance. Given that we are looking at Hillman Solutions as potential shareholders, the cost of equity is used as the discount rate, rather than the cost of capital (or weighted average cost of capital, WACC) which accounts for debt. In this calculation we've used 8.3%, which is based on a levered beta of 1.281. Beta is a measure of a stock's volatility, compared to the market as a whole. We get our beta from the industry average beta of globally comparable companies, with an imposed limit between 0.8 and 2.0, which is a reasonable range for a stable business.
SWOT Analysis for Hillman Solutions
Strength
Debt is well covered by cash flow.
Balance sheet summary for HLMN.
Weakness
Interest payments on debt are not well covered.
What are analysts forecasting for HLMN?
Opportunity
Expected to breakeven next year.
Has sufficient cash runway for more than 3 years based on current free cash flows.
Good value based on P/S ratio and estimated fair value.
Threat
No apparent threats visible for HLMN.
Moving On:
Valuation is only one side of the coin in terms of building your investment thesis, and it shouldn't be the only metric you look at when researching a company. The DCF model is not a perfect stock valuation tool. Rather it should be seen as a guide to "what assumptions need to be true for this stock to be under/overvalued?" For example, changes in the company's cost of equity or the risk free rate can significantly impact the valuation. Why is the intrinsic value higher than the current share price? For Hillman Solutions, we've put together three pertinent items you should assess:
Risks: For instance, we've identified 1 warning sign for Hillman Solutions that you should be aware of.
Management:Have insiders been ramping up their shares to take advantage of the market's sentiment for HLMN's future outlook? Check out our management and board analysis with insights on CEO compensation and governance factors.
Other Solid Businesses: Low debt, high returns on equity and good past performance are fundamental to a strong business. Why not explore our interactive list of stocks with solid business fundamentals to see if there are other companies you may not have considered!
PS. The Simply Wall St app conducts a discounted cash flow valuation for every stock on the NASDAQGM every day. If you want to find the calculation for other stocks just search here.
Have feedback on this article? Concerned about the content?Get in touch with us directly. Alternatively, email editorial-team (at) simplywallst.com. This article by Simply Wall St is general in nature. We provide commentary based on historical data and analyst forecasts only using an unbiased methodology and our articles are not intended to be financial advice. It does not constitute a recommendation to buy or sell any stock, and does not take account of your objectives, or your financial situation. We aim to bring you long-term focused analysis driven by fundamental data. Note that our analysis may not factor in the latest price-sensitive company announcements or qualitative material. Simply Wall St has no position in any stocks mentioned.