
 Yahoo Finance
 The three-year loss for Persimmon (LON:PSN) shareholders likely driven by its shrinking earnings
Persimmon Plc (LON:PSN) shareholders should be happy to see the share price up 10% in the last month. But that doesn't help the fact that the three year return is less impressive. Truth be told the share price declined 55% in three years and that return, Dear Reader, falls short of what you could have got from passive investing with an index fund.
The recent uptick of 3.4% could be a positive sign of things to come, so let's take a look at historical fundamentals.
View our latest analysis for Persimmon
While the efficient markets hypothesis continues to be taught by some, it has been proven that markets are over-reactive dynamic systems, and investors are not always rational. By comparing earnings per share (EPS) and share price changes over time, we can get a feel for how investor attitudes to a company have morphed over time.
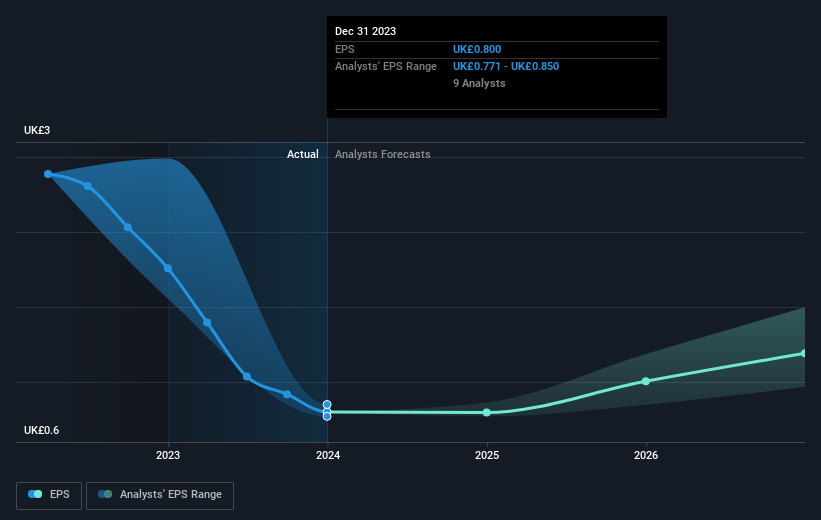
Persimmon saw its EPS decline at a compound rate of 26% per year, over the last three years. This fall in EPS isn't far from the rate of share price decline, which was 23% per year. That suggests that the market sentiment around the company hasn't changed much over that time, despite the disappointment. It seems like the share price is reflecting the declining earnings per share.
You can see how EPS has changed over time in the image below (click on the chart to see the exact values).
It's good to see that there was some significant insider buying in the last three months. That's a positive. On the other hand, we think the revenue and earnings trends are much more meaningful measures of the business. It might be well worthwhile taking a look at our free report on Persimmon's earnings, revenue and cash flow.
What About Dividends?
As well as measuring the share price return, investors should also consider the total shareholder return (TSR). Whereas the share price return only reflects the change in the share price, the TSR includes the value of dividends (assuming they were reinvested) and the benefit of any discounted capital raising or spin-off. So for companies that pay a generous dividend, the TSR is often a lot higher than the share price return. We note that for Persimmon the TSR over the last 3 years was -44%, which is better than the share price return mentioned above. This is largely a result of its dividend payments!
A Different Perspective
Persimmon shareholders gained a total return of 7.8% during the year. But that return falls short of the market. But at least that's still a gain! Over five years the TSR has been a reduction of 0.4% per year, over five years. It could well be that the business is stabilizing. It's always interesting to track share price performance over the longer term. But to understand Persimmon better, we need to consider many other factors. Even so, be aware that Persimmon is showing 3 warning signs in our investment analysis , you should know about...
If you like to buy stocks alongside management, then you might just love this free list of companies. (Hint: insiders have been buying them).
Please note, the market returns quoted in this article reflect the market weighted average returns of stocks that currently trade on British exchanges.
Have feedback on this article? Concerned about the content? Get in touch with us directly. Alternatively, email editorial-team (at) simplywallst.com.
This article by Simply Wall St is general in nature. We provide commentary based on historical data and analyst forecasts only using an unbiased methodology and our articles are not intended to be financial advice. It does not constitute a recommendation to buy or sell any stock, and does not take account of your objectives, or your financial situation. We aim to bring you long-term focused analysis driven by fundamental data. Note that our analysis may not factor in the latest price-sensitive company announcements or qualitative material. Simply Wall St has no position in any stocks mentioned.
