
Dillard's, Inc.'s (NYSE:DDS) Fundamentals Look Pretty Strong: Could The Market Be Wrong About The Stock?
Dillard's, Inc.'s (NYSE:DDS) Fundamentals Look Pretty Strong: Could The Market Be Wrong About The Stock?
 Return on Equity = Net Profit (from continuing operations) ÷ Shareholders' Equity
 It is hard to get excited after looking at Dillard's' (NYSE:DDS) recent performance, when its stock has declined 5.7% over the past week. However, stock prices are usually driven by a company's financial performance over the long term, which in this case looks quite promising. Particularly, we will be paying attention to Dillard's' ROE today.
看了迪拉德(紐約證券交易所代碼:DDS)最近的表現,很難感到興奮,當時其股價在過去一週下跌了5.7%。但是,股票價格通常由公司的長期財務業績驅動,在這種情況下,這看起來很有希望。特別是,我們今天將關注迪拉德的投資回報率。
Return on equity or ROE is an important factor to be considered by a shareholder because it tells them how effectively their capital is being reinvested. In other words, it is a profitability ratio which measures the rate of return on the capital provided by the company's shareholders.
股本回報率或投資回報率是股東需要考慮的重要因素,因爲它可以告訴他們資本再投資的有效性。換句話說,它是衡量公司股東提供的資本回報率的盈利比率。
How To Calculate Return On Equity?
如何計算股本回報率?
The formula for ROE is:
ROE 的公式是:
Return on Equity = Net Profit (from continuing operations) ÷ Shareholders' Equity
股本回報率 = 淨利潤(來自持續經營業務)÷ 股東權益
So, based on the above formula, the ROE for Dillard's is:
因此,根據上述公式,迪拉德的投資回報率爲:
44% = US$739m ÷ US$1.7b (Based on the trailing twelve months to February 2024).
44% = 7.39億美元 ÷ 17億美元(基於截至2024年2月的過去十二個月)。
The 'return' is the profit over the last twelve months. One way to conceptualize this is that for each $1 of shareholders' capital it has, the company made $0.44 in profit.
“回報” 是過去十二個月的利潤。對此進行概念化的一種方法是,該公司每擁有1美元的股東資本,就會獲得0.44美元的利潤。
What Is The Relationship Between ROE And Earnings Growth?
投資回報率與收益增長之間有什麼關係?
We have already established that ROE serves as an efficient profit-generating gauge for a company's future earnings. Based on how much of its profits the company chooses to reinvest or "retain", we are then able to evaluate a company's future ability to generate profits. Generally speaking, other things being equal, firms with a high return on equity and profit retention, have a higher growth rate than firms that don't share these attributes.
我們已經確定,投資回報率是衡量公司未來收益的有效盈利指標。根據公司選擇將多少利潤進行再投資或 “保留”,我們便能夠評估公司未來創造利潤的能力。一般而言,在其他條件相同的情況下,股本回報率和利潤留存率高的公司的增長率要高於不具有這些屬性的公司。
A Side By Side comparison of Dillard's' Earnings Growth And 44% ROE
迪拉德的收益增長和44%的投資回報率的並排比較
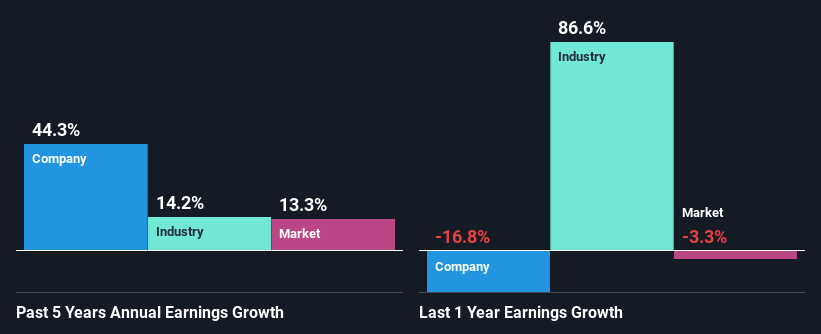
Firstly, we acknowledge that Dillard's has a significantly high ROE. Second, a comparison with the average ROE reported by the industry of 17% also doesn't go unnoticed by us. So, the substantial 44% net income growth seen by Dillard's over the past five years isn't overly surprising.
首先,我們承認迪拉德的投資回報率非常高。其次,與該行業報告的平均投資回報率爲17%的比較也不會被我們忽視。因此,迪拉德在過去五年中實現了44%的淨收入大幅增長並不令人驚訝。
We then compared Dillard's' net income growth with the industry and we're pleased to see that the company's growth figure is higher when compared with the industry which has a growth rate of 14% in the same 5-year period.
然後,我們將迪拉德的淨收入增長與該行業進行了比較,我們很高興地看到,與該行業相比,該公司的增長數字更高,該行業在同期的5年增長率爲14%。
The basis for attaching value to a company is, to a great extent, tied to its earnings growth. The investor should try to establish if the expected growth or decline in earnings, whichever the case may be, is priced in. Doing so will help them establish if the stock's future looks promising or ominous. Is DDS fairly valued? This infographic on the company's intrinsic value has everything you need to know.
爲公司附加價值的基礎在很大程度上與其收益增長息息相關。無論如何,投資者應設法確定預期的收益增長或下降是否已計入其中。這樣做將幫助他們確定股票的未來是樂觀還是不祥的。DDS 的價值是否合理?這張關於公司內在價值的信息圖包含了你需要知道的一切。
Is Dillard's Making Efficient Use Of Its Profits?
迪拉德是否在有效利用其利潤?
Dillard's' three-year median payout ratio to shareholders is 1.7%, which is quite low. This implies that the company is retaining 98% of its profits. This suggests that the management is reinvesting most of the profits to grow the business as evidenced by the growth seen by the company.
迪拉德的三年股東派息率中位數爲1.7%,相當低。這意味着該公司保留了98%的利潤。這表明管理層正在將大部分利潤再投資於業務增長,公司的增長就證明了這一點。
Additionally, Dillard's has paid dividends over a period of at least ten years which means that the company is pretty serious about sharing its profits with shareholders.
此外,迪拉德已經在至少十年內派發了股息,這意味着該公司非常認真地與股東分享利潤。
Conclusion
結論
On the whole, we feel that Dillard's' performance has been quite good. Specifically, we like that the company is reinvesting a huge chunk of its profits at a high rate of return. This of course has caused the company to see substantial growth in its earnings. That being so, according to the latest industry analyst forecasts, the company's earnings are expected to shrink in the future. Are these analysts expectations based on the broad expectations for the industry, or on the company's fundamentals? Click here to be taken to our analyst's forecasts page for the company.
總的來說,我們覺得迪拉德的表現相當不錯。具體而言,我們喜歡該公司以高回報率再投資其利潤的很大一部分。當然,這導致該公司的收益大幅增長。既然如此,根據最新的行業分析師預測,該公司的收益預計將在未來萎縮。這些分析師的預期是基於對該行業的廣泛預期,還是基於公司的基本面?點擊此處進入我們分析師對公司的預測頁面。
Have feedback on this article? Concerned about the content? Get in touch with us directly. Alternatively, email editorial-team (at) simplywallst.com.
This article by Simply Wall St is general in nature. We provide commentary based on historical data and analyst forecasts only using an unbiased methodology and our articles are not intended to be financial advice. It does not constitute a recommendation to buy or sell any stock, and does not take account of your objectives, or your financial situation. We aim to bring you long-term focused analysis driven by fundamental data. Note that our analysis may not factor in the latest price-sensitive company announcements or qualitative material. Simply Wall St has no position in any stocks mentioned.
對這篇文章有反饋嗎?對內容感到擔憂?直接聯繫我們。 或者,給編輯團隊 (at) simplywallst.com 發送電子郵件。
Simply Wall St的這篇文章本質上是籠統的。我們僅使用公正的方法根據歷史數據和分析師的預測提供評論,我們的文章無意作爲財務建議。它不構成買入或賣出任何股票的建議,也沒有考慮到您的目標或財務狀況。我們的目標是爲您提供由基本數據驅動的長期重點分析。請注意,我們的分析可能不考慮最新的價格敏感型公司公告或定性材料。簡而言之,華爾街沒有持有任何上述股票的頭寸。
譯文內容由第三人軟體翻譯。
