
Returns At STAAR Surgical (NASDAQ:STAA) Appear To Be Weighed Down
Returns At STAAR Surgical (NASDAQ:STAA) Appear To Be Weighed Down
To find a multi-bagger stock, what are the underlying trends we should look for in a business? Amongst other things, we'll want to see two things; firstly, a growing return on capital employed (ROCE) and secondly, an expansion in the company's amount of capital employed. Put simply, these types of businesses are compounding machines, meaning they are continually reinvesting their earnings at ever-higher rates of return. Having said that, from a first glance at STAAR Surgical (NASDAQ:STAA) we aren't jumping out of our chairs at how returns are trending, but let's have a deeper look.
要找到一隻多袋裝箱的股票,我們應該在企業中尋找哪些潛在趨勢?除其他外,我們希望看到兩件事;首先,成長 返回 論資本使用率(ROCE),其次是公司的擴張 金額 所用資本的比例。簡而言之,這些類型的企業是複合機器,這意味着他們不斷以更高的回報率對收益進行再投資。話雖如此,乍一看STAAR Surgical(納斯達克股票代碼:STAA),我們並不是對回報趨勢不屑一顧,但讓我們更深入地了解一下。
What Is Return On Capital Employed (ROCE)?
什麼是資本使用回報率(ROCE)?
If you haven't worked with ROCE before, it measures the 'return' (pre-tax profit) a company generates from capital employed in its business. To calculate this metric for STAAR Surgical, this is the formula:
如果你以前沒有與ROCE合作過,它會衡量公司從其業務中使用的資本中產生的 “回報”(稅前利潤)。要計算 STAAR Surgical 的這個指標,公式如下:
Return on Capital Employed = Earnings Before Interest and Tax (EBIT) ÷ (Total Assets - Current Liabilities)
已動用資本回報率 = 息稅前收益 (EBIT) ¥(總資產-流動負債)
0.057 = US$25m ÷ (US$493m - US$63m) (Based on the trailing twelve months to March 2024).
0.057 = 2,500萬美元 ÷(4.93億美元-6,300萬美元) (基於截至2024年3月的過去十二個月)。
So, STAAR Surgical has an ROCE of 5.7%. In absolute terms, that's a low return and it also under-performs the Medical Equipment industry average of 10%.
因此,STAAR Surgical的投資回報率爲5.7%。從絕對值來看,回報率很低,而且表現也低於醫療設備行業10%的平均水平。
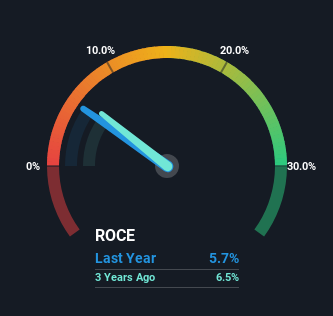
Above you can see how the current ROCE for STAAR Surgical compares to its prior returns on capital, but there's only so much you can tell from the past. If you'd like, you can check out the forecasts from the analysts covering STAAR Surgical for free.
上面你可以看到STAAR Surgical當前的投資回報率與其先前的資本回報率相比如何,但從過去可以看出來的只有那麼多。如果你願意,你可以免費查看報道STAAR Surgical的分析師的預測。
How Are Returns Trending?
退貨趨勢如何?
In terms of STAAR Surgical's historical ROCE trend, it doesn't exactly demand attention. Over the past five years, ROCE has remained relatively flat at around 5.7% and the business has deployed 189% more capital into its operations. Given the company has increased the amount of capital employed, it appears the investments that have been made simply don't provide a high return on capital.
就STAAR Surgical的歷史投資回報率趨勢而言,這並不完全值得關注。在過去的五年中,投資回報率一直保持相對平穩,約爲5.7%,該業務在運營中投入的資金增加了189%。鑑於該公司增加了動用資本金額,看來已經進行的投資根本無法提供很高的資本回報率。
Our Take On STAAR Surgical's ROCE
我們對STAAR Surgical的投資回報率的看法
Long story short, while STAAR Surgical has been reinvesting its capital, the returns that it's generating haven't increased. Since the stock has gained an impressive 76% over the last five years, investors must think there's better things to come. Ultimately, if the underlying trends persist, we wouldn't hold our breath on it being a multi-bagger going forward.
長話短說,儘管STAAR Surgical一直在對其資本進行再投資,但其產生的回報並沒有增加。由於該股在過去五年中上漲了令人印象深刻的76%,因此投資者必須認爲會有更好的事情發生。歸根結底,如果潛在的趨勢持續下去,我們就不會屏住呼吸了,因爲它是未來的 “多管齊下”。
On a final note, we've found 1 warning sign for STAAR Surgical that we think you should be aware of.
最後,我們發現了STAAR Surgical的1個警告信號,我們認爲你應該注意這個信號。
While STAAR Surgical isn't earning the highest return, check out this free list of companies that are earning high returns on equity with solid balance sheets.
儘管STAAR Surgical的回報率並不高,但請查看這份免費清單,列出了資產負債表穩健的股本回報率高的公司。
Have feedback on this article? Concerned about the content? Get in touch with us directly. Alternatively, email editorial-team (at) simplywallst.com.
This article by Simply Wall St is general in nature. We provide commentary based on historical data and analyst forecasts only using an unbiased methodology and our articles are not intended to be financial advice. It does not constitute a recommendation to buy or sell any stock, and does not take account of your objectives, or your financial situation. We aim to bring you long-term focused analysis driven by fundamental data. Note that our analysis may not factor in the latest price-sensitive company announcements or qualitative material. Simply Wall St has no position in any stocks mentioned.
對這篇文章有反饋嗎?對內容感到擔憂?直接聯繫我們。 或者,給編輯團隊 (at) simplywallst.com 發送電子郵件。
Simply Wall St的這篇文章本質上是籠統的。我們僅使用公正的方法根據歷史數據和分析師的預測提供評論,我們的文章無意作爲財務建議。它不構成買入或賣出任何股票的建議,也沒有考慮到您的目標或財務狀況。我們的目標是爲您提供由基本數據驅動的長期重點分析。請注意,我們的分析可能不考慮最新的價格敏感型公司公告或定性材料。簡而言之,華爾街沒有持有任何上述股票的頭寸。
譯文內容由第三人軟體翻譯。