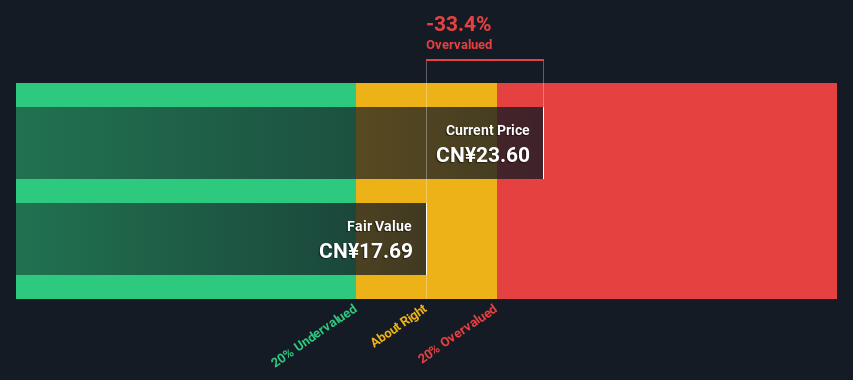
Using the 2 Stage Free Cash Flow to Equity, Shinva Medical InstrumentLtd fair value estimate is CN¥17.69
Shinva Medical InstrumentLtd's CN¥23.60 share price signals that it might be 33% overvalued
Analyst price target for 600587 is CN¥31.53, which is 78% above our fair value estimate
Today we will run through one way of estimating the intrinsic value of Shinva Medical Instrument Co.,Ltd. (SHSE:600587) by taking the expected future cash flows and discounting them to today's value. We will use the Discounted Cash Flow (DCF) model on this occasion. Don't get put off by the jargon, the math behind it is actually quite straightforward.
Remember though, that there are many ways to estimate a company's value, and a DCF is just one method. For those who are keen learners of equity analysis, the Simply Wall St analysis model here may be something of interest to you.
What's The Estimated Valuation?
We're using the 2-stage growth model, which simply means we take in account two stages of company's growth. In the initial period the company may have a higher growth rate and the second stage is usually assumed to have a stable growth rate. To start off with, we need to estimate the next ten years of cash flows. Seeing as no analyst estimates of free cash flow are available to us, we have extrapolate the previous free cash flow (FCF) from the company's last reported value. We assume companies with shrinking free cash flow will slow their rate of shrinkage, and that companies with growing free cash flow will see their growth rate slow, over this period. We do this to reflect that growth tends to slow more in the early years than it does in later years.
A DCF is all about the idea that a dollar in the future is less valuable than a dollar today, so we need to discount the sum of these future cash flows to arrive at a present value estimate:
10-year free cash flow (FCF) estimate
2024
2025
2026
2027
2028
2029
2030
2031
2032
2033
Levered FCF (CN¥, Millions)
CN¥433.7m
CN¥451.2m
CN¥467.9m
CN¥484.1m
CN¥500.0m
CN¥515.9m
CN¥531.8m
CN¥548.0m
CN¥564.4m
CN¥581.1m
Growth Rate Estimate Source
Est @ 4.53%
Est @ 4.04%
Est @ 3.70%
Est @ 3.46%
Est @ 3.29%
Est @ 3.17%
Est @ 3.09%
Est @ 3.03%
Est @ 2.99%
Est @ 2.97%
Present Value (CN¥, Millions) Discounted @ 8.3%
CN¥400
CN¥385
CN¥368
CN¥352
CN¥335
CN¥319
CN¥304
CN¥289
CN¥275
CN¥261
("Est" = FCF growth rate estimated by Simply Wall St) Present Value of 10-year Cash Flow (PVCF) = CN¥3.3b
We now need to calculate the Terminal Value, which accounts for all the future cash flows after this ten year period. For a number of reasons a very conservative growth rate is used that cannot exceed that of a country's GDP growth. In this case we have used the 5-year average of the 10-year government bond yield (2.9%) to estimate future growth. In the same way as with the 10-year 'growth' period, we discount future cash flows to today's value, using a cost of equity of 8.3%.
Present Value of Terminal Value (PVTV)= TV / (1 + r)10= CN¥11b÷ ( 1 + 8.3%)10= CN¥5.0b
The total value, or equity value, is then the sum of the present value of the future cash flows, which in this case is CN¥8.3b. To get the intrinsic value per share, we divide this by the total number of shares outstanding. Compared to the current share price of CN¥23.6, the company appears reasonably expensive at the time of writing. Valuations are imprecise instruments though, rather like a telescope - move a few degrees and end up in a different galaxy. Do keep this in mind.
SHSE:600587 Discounted Cash Flow May 12th 2024
Important Assumptions
The calculation above is very dependent on two assumptions. The first is the discount rate and the other is the cash flows. Part of investing is coming up with your own evaluation of a company's future performance, so try the calculation yourself and check your own assumptions. The DCF also does not consider the possible cyclicality of an industry, or a company's future capital requirements, so it does not give a full picture of a company's potential performance. Given that we are looking at Shinva Medical InstrumentLtd as potential shareholders, the cost of equity is used as the discount rate, rather than the cost of capital (or weighted average cost of capital, WACC) which accounts for debt. In this calculation we've used 8.3%, which is based on a levered beta of 0.962. Beta is a measure of a stock's volatility, compared to the market as a whole. We get our beta from the industry average beta of globally comparable companies, with an imposed limit between 0.8 and 2.0, which is a reasonable range for a stable business.
SWOT Analysis for Shinva Medical InstrumentLtd
Strength
Earnings growth over the past year exceeded the industry.
Debt is not viewed as a risk.
Dividends are covered by earnings and cash flows.
Dividend information for 600587.
Weakness
Dividend is low compared to the top 25% of dividend payers in the Medical Equipment market.
Opportunity
Annual earnings are forecast to grow for the next 3 years.
Good value based on P/E ratio compared to estimated Fair P/E ratio.
Threat
Annual earnings are forecast to grow slower than the Chinese market.
What else are analysts forecasting for 600587?
Next Steps:
Whilst important, the DCF calculation shouldn't be the only metric you look at when researching a company. It's not possible to obtain a foolproof valuation with a DCF model. Instead the best use for a DCF model is to test certain assumptions and theories to see if they would lead to the company being undervalued or overvalued. If a company grows at a different rate, or if its cost of equity or risk free rate changes sharply, the output can look very different. What is the reason for the share price exceeding the intrinsic value? For Shinva Medical InstrumentLtd, there are three relevant items you should explore:
Risks: We feel that you should assess the 1 warning sign for Shinva Medical InstrumentLtd we've flagged before making an investment in the company.
Future Earnings: How does 600587's growth rate compare to its peers and the wider market? Dig deeper into the analyst consensus number for the upcoming years by interacting with our free analyst growth expectation chart.
Other High Quality Alternatives: Do you like a good all-rounder? Explore our interactive list of high quality stocks to get an idea of what else is out there you may be missing!
PS. Simply Wall St updates its DCF calculation for every Chinese stock every day, so if you want to find the intrinsic value of any other stock just search here.
Have feedback on this article? Concerned about the content?Get in touch with us directly. Alternatively, email editorial-team (at) simplywallst.com. This article by Simply Wall St is general in nature. We provide commentary based on historical data and analyst forecasts only using an unbiased methodology and our articles are not intended to be financial advice. It does not constitute a recommendation to buy or sell any stock, and does not take account of your objectives, or your financial situation. We aim to bring you long-term focused analysis driven by fundamental data. Note that our analysis may not factor in the latest price-sensitive company announcements or qualitative material. Simply Wall St has no position in any stocks mentioned.
關鍵見解
按兩階段自由現金流股本計算,Shinva Medical InstrumentLtd的公允價值估計爲17.69元人民幣
Shinva Medical InstrumentLtd的23.60元人民幣股價表明其估值可能高估了33%
上面的計算在很大程度上取決於兩個假設。第一個是貼現率,另一個是現金流。投資的一部分是自己對公司未來業績的評估,因此請自己嘗試計算並檢查自己的假設。DCF也沒有考慮一個行業可能的週期性,也沒有考慮公司未來的資本需求,因此它沒有全面反映公司的潛在表現。鑑於我們將Shinva Medical InstrumentLtd視爲潛在股東,因此使用權益成本作爲貼現率,而不是構成債務的資本成本(或加權平均資本成本,WACC)。在此計算中,我們使用了8.3%,這是基於0.962的槓桿測試版。Beta是衡量股票與整個市場相比波動性的指標。我們的測試版來自全球可比公司的行業平均貝塔值,設定在0.8到2.0之間,這是一個穩定的業務的合理範圍。
信華醫療器械有限公司的 SWOT 分析
力量
過去一年的收益增長超過了該行業。
債務不被視爲風險。
股息由收益和現金流支付。
600587的股息信息。
弱點
與醫療設備市場前25%的股息支付者相比,股息很低。
機會
預計未來三年的年收入將增長。
與估計的公允市盈率相比,基於市盈率,物有所值。
威脅
預計年收益增長將低於中國市場。
分析師對600587還有什麼預測?
後續步驟:
儘管重要,但DCF的計算不應是你在研究公司時唯一考慮的指標。使用DCF模型不可能獲得萬無一失的估值。相反,DCF模型的最佳用途是測試某些假設和理論,看看它們是否會導致公司被低估或高估。如果一家公司以不同的速度增長,或者其股本成本或無風險利率急劇變化,則產出可能會大不相同。股價超過內在價值的原因是什麼?對於 Shinva Medical InstrumentLtd 來說,你應該探索三個相關項目:
風險:我們認爲,在投資Shinva Medical InstrumentLtd之前,您應該評估我們標記的1個警告信號。