
DoubleDown Interactive Co., Ltd.'s (NASDAQ:DDI) Stock Has Seen Strong Momentum: Does That Call For Deeper Study Of Its Financial Prospects?
DoubleDown Interactive Co., Ltd.'s (NASDAQ:DDI) Stock Has Seen Strong Momentum: Does That Call For Deeper Study Of Its Financial Prospects?
DoubleDown Interactive's (NASDAQ:DDI) stock is up by a considerable 39% over the past three months. We wonder if and what role the company's financials play in that price change as a company's long-term fundamentals usually dictate market outcomes. In this article, we decided to focus on DoubleDown Interactive's ROE.
過去三個月,DoubleDown Interactive (NASDAQ:DDI)的股價已上漲了相當可觀的39%。我們想知道公司的財務狀況是否對股價的變化起了什麼作用,因爲一家公司的長期基本面通常決定市場結果。在本文中,我們決定着重研究DoubleDown Interactive的roe。
Return on equity or ROE is a key measure used to assess how efficiently a company's management is utilizing the company's capital. In other words, it is a profitability ratio which measures the rate of return on the capital provided by the company's shareholders.
淨資產收益率(roe)是衡量公司經營管理層如何有效利用公司資本的關鍵指標。換言之,它是一種利潤率,衡量由公司股東提供的資本的回報率。
How Is ROE Calculated?
淨資產收益率怎麼計算?
Return on equity can be calculated by using the formula:
股東權益報酬率可以使用以下公式計算:
Return on Equity = Net Profit (from continuing operations) ÷ Shareholders' Equity
淨資產收益率 = 淨利潤(從持續經營中獲得)÷ 股東權益
So, based on the above formula, the ROE for DoubleDown Interactive is:
因此,根據上述公式,DoubleDown Interactive的ROE爲:
13% = ₩133b ÷ ₩986b (Based on the trailing twelve months to December 2023).
13%=₩133b ÷₩986b(基於截至2023年12月的過去12個月)。
The 'return' is the yearly profit. One way to conceptualize this is that for each $1 of shareholders' capital it has, the company made $0.13 in profit.
'回報'是每年的利潤。一個概念化的方法是,在每$1的股東資本中,公司賺取了$0.13的利潤。
What Is The Relationship Between ROE And Earnings Growth?
既然我們已經確定ROE是一種有效的利潤生成標準,用於評估公司未來的盈利能力,我們現在需要評估公司“保留”爲未來增長而重新投資的利潤多少,這使我們對公司的增長潛力有了一個了解。一般而言,在其他條件相等的情況下,ROE和利潤留存高的公司,增長率比沒有這些屬性的公司要高。
So far, we've learned that ROE is a measure of a company's profitability. Depending on how much of these profits the company reinvests or "retains", and how effectively it does so, we are then able to assess a company's earnings growth potential. Assuming everything else remains unchanged, the higher the ROE and profit retention, the higher the growth rate of a company compared to companies that don't necessarily bear these characteristics.
到目前爲止,我們已經了解了roe是公司盈利能力的一種衡量標準。根據公司重新投資或“保留”的利潤數量和效率,我們可以評估公司的盈利增長潛力。假設其他所有因素保持不變,roe和保留的利潤越高,相對於不一定具有這些特徵的公司,公司的增長率就越高。
DoubleDown Interactive's Earnings Growth And 13% ROE
DoubleDown Interactive的盈利增長和13%的ROE。
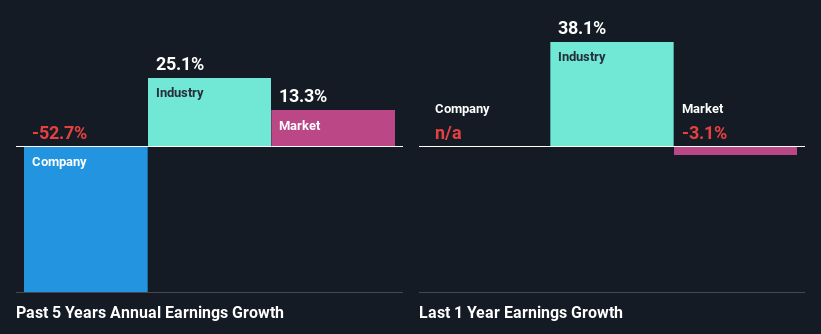
To start with, DoubleDown Interactive's ROE looks acceptable. And on comparing with the industry, we found that the the average industry ROE is similar at 13%. For this reason, DoubleDown Interactive's five year net income decline of 53% raises the question as to why the decent ROE didn't translate into growth. So, there might be some other aspects that could explain this. Such as, the company pays out a huge portion of its earnings as dividends, or is faced with competitive pressures.
首先,DoubleDown Interactive的ROE看起來是可以接受的。與行業相比,我們發現平均行業ROE也是13%左右。因此,DoubleDown Interactive五年的淨利潤下降了53%,這引出了一個問題:爲什麼相當不錯的ROE沒有轉化爲增長?因此,可能存在其他方面可以解釋這個問題,例如公司將其收益的大部分分紅派息,或者面臨競爭壓力。
That being said, we compared DoubleDown Interactive's performance with the industry and were concerned when we found that while the company has shrunk its earnings, the industry has grown its earnings at a rate of 25% in the same 5-year period.
儘管如此,我們將DoubleDown Interactive的表現與行業進行了比較,並在發現在同一個5年期間,公司的收益已經縮減,而行業的收益增長了25%時感到擔憂。
The basis for attaching value to a company is, to a great extent, tied to its earnings growth. It's important for an investor to know whether the market has priced in the company's expected earnings growth (or decline). Doing so will help them establish if the stock's future looks promising or ominous. Is DoubleDown Interactive fairly valued compared to other companies? These 3 valuation measures might help you decide.
給公司附加價值的基礎在很大程度上與其盈利增長相關。投資者知道市場是否已經定價了公司預期的盈利增長(或下降)是很重要的。這樣做將幫助他們確定股票的未來前景,是有前途還是不良。與其他公司相比,DoubleDown Interactive的價值是否公平?這3個估值指標可能會有所幫助。
Is DoubleDown Interactive Efficiently Re-investing Its Profits?
DoubleDown Interactive是否有效地重新投資其利潤?DoubleDown Interactive不支付任何定期股息,這意味着公司保留了所有利潤,這讓我們想知道,如果無法利用利潤來發展業務,爲什麼要保留利潤。看起來可能有其他原因解釋其中的缺失。例如,業務可能正在衰退。
DoubleDown Interactive doesn't pay any regular dividends, meaning that the company is keeping all of its profits, which makes us wonder why it is retaining its earnings if it can't use them to grow its business. It looks like there might be some other reasons to explain the lack in that respect. For example, the business could be in decline.
總的來說,DoubleDown Interactive業務中有一些積極因素。然而,低盈利增長有點令人擔憂,特別是考慮到公司具有高回報率並且正在重新投資其利潤的大部分資金。看起來可能有其他因素不在業務的控制之下,阻止了增長。雖然我們不會完全駁回該公司,但我們會嘗試確定業務有多大風險以做出更明智的決策。
Summary
總的來說,我們對偉明環保的表現非常滿意。具體而言,我們喜歡公司以高回報率再投資了其利潤的很大一部分。當然,這導致公司的收益大幅增長。但是,最新的行業分析師預測表明,該公司的收益預計將加速增長。
In total, it does look like DoubleDown Interactive has some positive aspects to its business. Yet, the low earnings growth is a bit concerning, especially given that the company has a high rate of return and is reinvesting ma huge portion of its profits. By the looks of it, there could be some other factors, not necessarily in control of the business, that's preventing growth. While we won't completely dismiss the company, what we would do, is try to ascertain how risky the business is to make a more informed decision around the company. To know the 1 risk we have identified for DoubleDown Interactive visit our risks dashboard for free.
要了解DoubleDown Interactive因風險而面臨的1個風險,請訪問我們的風險儀表板免費了解。
Have feedback on this article? Concerned about the content? Get in touch with us directly. Alternatively, email editorial-team (at) simplywallst.com.
This article by Simply Wall St is general in nature. We provide commentary based on historical data and analyst forecasts only using an unbiased methodology and our articles are not intended to be financial advice. It does not constitute a recommendation to buy or sell any stock, and does not take account of your objectives, or your financial situation. We aim to bring you long-term focused analysis driven by fundamental data. Note that our analysis may not factor in the latest price-sensitive company announcements or qualitative material. Simply Wall St has no position in any stocks mentioned.
對本文有反饋?關於內容有所顧慮?直接和我們聯繫。或者,發送電子郵件至editorial-team (at) simplywallst.com。
這篇文章是Simply Wall St的一般性文章。我們根據歷史數據和分析師預測提供評論,只使用公正的方法論,我們的文章並不意味着提供任何金融建議。文章不構成買賣任何股票的建議,也不考慮您的目標或您的財務狀況。我們的目標是帶給您基本數據驅動的長期關注分析。請注意,我們的分析可能不考慮最新的價格敏感公司公告或定性材料。Simply Wall St沒有任何股票頭寸。
譯文內容由第三人軟體翻譯。