
There May Be Some Bright Spots In Omega Flex's (NASDAQ:OFLX) Earnings
There May Be Some Bright Spots In Omega Flex's (NASDAQ:OFLX) Earnings
Shareholders appeared unconcerned with Omega Flex, Inc.'s (NASDAQ:OFLX) lackluster earnings report last week. Our analysis suggests that while the profits are soft, the foundations of the business are strong.
股東們似乎對歐米茄弗萊克斯公司漠不關心。”s(納斯達克股票代碼:OFLX)上週的收益報告乏善可陳。我們的分析表明,儘管利潤疲軟,但業務基礎卻很牢固。
Zooming In On Omega Flex's Earnings
放大Omega Flex的收益
As finance nerds would already know, the accrual ratio from cashflow is a key measure for assessing how well a company's free cash flow (FCF) matches its profit. To get the accrual ratio we first subtract FCF from profit for a period, and then divide that number by the average operating assets for the period. This ratio tells us how much of a company's profit is not backed by free cashflow.
正如金融迷已經知道的那樣,現金流的應計比率是評估公司自由現金流(FCF)與利潤匹配程度的關鍵指標。爲了獲得應計比率,我們首先從一段時期的利潤中減去FCF,然後將該數字除以該期間的平均運營資產。這個比率告訴我們,一家公司的利潤中有多少沒有自由現金流的支持。
Therefore, it's actually considered a good thing when a company has a negative accrual ratio, but a bad thing if its accrual ratio is positive. That is not intended to imply we should worry about a positive accrual ratio, but it's worth noting where the accrual ratio is rather high. That's because some academic studies have suggested that high accruals ratios tend to lead to lower profit or less profit growth.
因此,當公司的應計比率爲負時,這實際上被認爲是一件好事,但是如果應計比率爲正,則被認爲是一件壞事。這並不意味着我們應該擔心應計比率爲正,但值得注意的是,應計比率相當高的地方。那是因爲一些學術研究表明,高應計比率往往會導致利潤下降或利潤增長放緩。
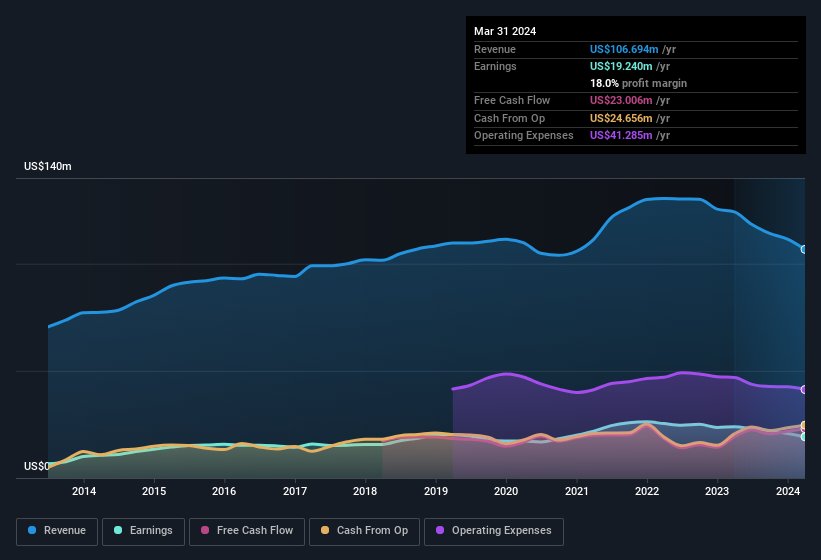
Over the twelve months to March 2024, Omega Flex recorded an accrual ratio of -0.10. That indicates that its free cash flow was a fair bit more than its statutory profit. To wit, it produced free cash flow of US$23m during the period, dwarfing its reported profit of US$19.2m. Omega Flex's free cash flow improved over the last year, which is generally good to see.
在截至2024年3月的十二個月中,歐米茄靈活的應計比率爲-0.10。這表明其自由現金流遠超過其法定利潤。換句話說,它在此期間產生了2300萬美元的自由現金流,使其報告的1,920萬美元利潤相形見絀。Omega Flex的自由現金流比去年有所改善,總體而言,這是值得期待的。
Note: we always recommend investors check balance sheet strength. Click here to be taken to our balance sheet analysis of Omega Flex.
注意:我們始終建議投資者檢查資產負債表的實力。點擊此處查看我們對Omega Flex的資產負債表分析。
Our Take On Omega Flex's Profit Performance
我們對Omega Flex利潤表現的看法
Omega Flex's accrual ratio is solid, and indicates strong free cash flow, as we discussed, above. Because of this, we think Omega Flex's earnings potential is at least as good as it seems, and maybe even better! On the other hand, its EPS actually shrunk in the last twelve months. Of course, we've only just scratched the surface when it comes to analysing its earnings; one could also consider margins, forecast growth, and return on investment, among other factors. While earnings are important, another area to consider is the balance sheet. You can see our latest analysis on Omega Flex's balance sheet health here.
正如我們在上面討論的那樣,Omega Flex的應計比率很穩定,表明自由現金流強勁。因此,我們認爲Omega Flex的盈利潛力至少和看起來一樣好,甚至可能更好!另一方面,其每股收益實際上在過去十二個月中萎縮了。當然,我們只是在分析其收益時才浮出水面;人們還可以考慮利潤率、預測增長和投資回報率等因素。雖然收益很重要,但另一個需要考慮的領域是資產負債表。您可以在此處查看我們對Omega Flex資產負債表狀況的最新分析。
This note has only looked at a single factor that sheds light on the nature of Omega Flex's profit. But there is always more to discover if you are capable of focussing your mind on minutiae. Some people consider a high return on equity to be a good sign of a quality business. While it might take a little research on your behalf, you may find this free collection of companies boasting high return on equity, or this list of stocks that insiders are buying to be useful.
本報告僅研究了揭示Omega Flex利潤性質的單一因素。但是,如果你能夠將注意力集中在細節上,總會有更多的事情需要發現。有些人認爲高股本回報率是優質業務的好兆頭。雖然可能需要你進行一些研究,但你可能會發現這份免費收集的擁有高股本回報率的公司,或者這份內部人士正在購買的股票清單很有用。
Have feedback on this article? Concerned about the content? Get in touch with us directly. Alternatively, email editorial-team (at) simplywallst.com.
This article by Simply Wall St is general in nature. We provide commentary based on historical data and analyst forecasts only using an unbiased methodology and our articles are not intended to be financial advice. It does not constitute a recommendation to buy or sell any stock, and does not take account of your objectives, or your financial situation. We aim to bring you long-term focused analysis driven by fundamental data. Note that our analysis may not factor in the latest price-sensitive company announcements or qualitative material. Simply Wall St has no position in any stocks mentioned.
對這篇文章有反饋嗎?對內容感到擔憂?直接聯繫我們。 或者,給編輯團隊 (at) simplywallst.com 發送電子郵件。
Simply Wall St的這篇文章本質上是籠統的。我們僅使用公正的方法根據歷史數據和分析師的預測提供評論,我們的文章無意作爲財務建議。它不構成買入或賣出任何股票的建議,也沒有考慮到您的目標或財務狀況。我們的目標是爲您提供由基本數據驅動的長期重點分析。請注意,我們的分析可能不考慮最新的價格敏感型公司公告或定性材料。簡而言之,華爾街沒有持有任何上述股票的頭寸。
譯文內容由第三人軟體翻譯。