COST Elliott Wave technical analysis
Function: Trend.
Mode: Impulsive.
Structure: Motive.
Position: Minor 5.
Direction: Upside in Minor 5.
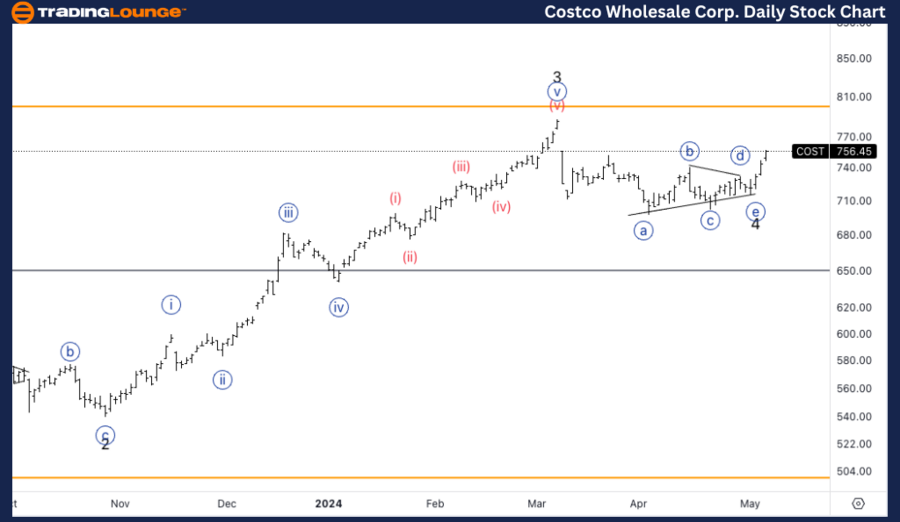
Details: Trading Level 8 at 800$ will provide resistance, looking for a five wave move to unfold in wave 5.
COST Elliott Wave technical analysis – Daily chart
The daily chart of Costco reveals that the stock is currently in an impulsive, motive wave structure, specifically identified as Minor wave 5. This indicates an upward trend with expectations of continuing momentum. The analysis points out that the $800 price level, referred to as TradingLevel8, is expected to act as a significant resistance. In this phase, a five-wave structure within wave 5 is anticipated to unfold, suggesting sustained upward movement.
COST Elliott Wave technical analysis
Function: Trend.
Mode: Impulsive.
Structure: Motive.
Position: Wave {i} of 5.
Direction: Pullback in wave {ii}.
Details: Looking for a pullback in wave {ii} to then continue higher and target longs. We seem to be finding support on 720$.
This comprehensive Elliott Wave analysis provides a current and future perspective on Costco Wholesale Corporation (COST), focusing on the potential price movements as indicated by the Elliott Wave theory on the daily and 4-hour charts as of May 7, 2024. Investors and traders can leverage this detailed insight to optimize their market positions.
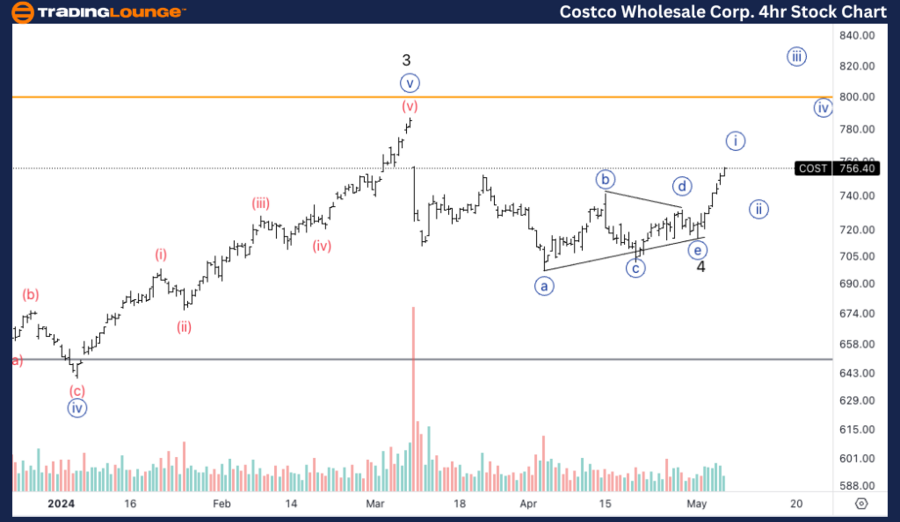
COST Elliott Wave technical analysis – Four-hour chart
Zooming into the 4-hour chart, Costco is currently positioned in Wave {i} of Minor 5, and a pullback in Wave {ii} is expected. This pullback presents a strategic entry point for traders, with the stock finding preliminary support at the $720 level. Following this correction, a continuation higher in Wave {iii} is likely.
Costco Wholesale Corp.(COST) Elliott Wave technical analysis [Video]
As with any investment opportunity there is a risk of making losses on investments that Trading Lounge expresses opinions on.
Historical results are no guarantee of future returns. Some investments are inherently riskier than others. At worst, you could lose your entire investment. TradingLounge™ uses a range of technical analysis tools, software and basic fundamental analysis as well as economic forecasts aimed at minimizing the potential for loss.
The advice we provide through our TradingLounge™ websites and our TradingLounge™ Membership has been prepared without considering your objectives, financial situation or needs. Reliance on such advice, information or data is at your own risk. The decision to trade and the method of trading is for you alone to decide. This information is of a general nature only, so you should, before acting upon any of the information or advice provided by us, consider the appropriateness of the advice considering your own objectives, financial situation or needs. Therefore, you should consult your financial advisor or accountant to determine whether trading in securities and derivatives products is appropriate for you considering your financial circumstances.
Recommended content
Editors’ Picks
AUD/USD trades with mild positive bias near 0.6700, RBA Meeting Minutes eyed

The AUD/USD trades with a mild positive bias near 0.6695 during the early Asian session on Monday. The weaker US Dollar provides some support to the pair. The Fed’s Bostic, Barr, Waller, Jefferson, and Mester are set to speak on Monday.
EUR/USD: Could FOMC Minutes provide fresh clues?

The EUR/USD pair advanced for a fourth consecutive week, comfortably trading around 1.0860 ahead of the close. Progress had been shallow, as the pair is up roughly 250 pips from the year low of 1.0600 posted mid-April.
Gold looks to extend uptrend once it confirms $2,400 as support

Gold price continued to push higher last week and rose above $2,400 on Friday, gaining nearly 2% for the week. Investors will continue to scrutinize comments from Fed officials this week and look for fresh hints on the timing of the policy pivot in the minutes of the April 30-May 1 meeting.
AI tokens could really ahead of Nvidia earnings

Native cryptocurrencies of several blockchain projects using Artificial Intelligence could register gains in the coming week as the market prepares for NVIDIA earnings report.
Week ahead: Flash PMIs, UK and Japan CPIs in focus. RBNZ to hold rates

After cool US CPI, attention shifts to UK and Japanese inflation. Flash PMIs will be watched too amid signs of a rebound in Europe. Fed to stay in the spotlight as plethora of speakers, minutes on tap.