
Vector Group's (NYSE:VGR) Earnings Growth Rate Lags the 5.4% CAGR Delivered to Shareholders
Vector Group's (NYSE:VGR) Earnings Growth Rate Lags the 5.4% CAGR Delivered to Shareholders
For many investors, the main point of stock picking is to generate higher returns than the overall market. But in any portfolio, there are likely to be some stocks that fall short of that benchmark. We regret to report that long term Vector Group Ltd. (NYSE:VGR) shareholders have had that experience, with the share price dropping 33% in three years, versus a market return of about 16%. More recently, the share price has dropped a further 11% in a month. Importantly, this could be a market reaction to the recently released financial results. You can check out the latest numbers in our company report.
对于许多投资者来说,选股的要点是产生比整个市场更高的回报。但是在任何投资组合中,都可能有一些股票未达到该基准。我们遗憾地报告,Vector Group Ltd.(纽约证券交易所代码:VGR)的长期股东有过这样的经历,股价在三年内下跌了33%,而市场回报率约为16%。最近,股价在一个月内又下跌了11%。重要的是,这可能是市场对最近公布的财务业绩的反应。你可以在我们的公司报告中查看最新的数字。
If the past week is anything to go by, investor sentiment for Vector Group isn't positive, so let's see if there's a mismatch between fundamentals and the share price.
如果过去一周有意义的话,投资者对Vector Group的情绪并不乐观,所以让我们看看基本面和股价之间是否存在不匹配的情况。
While markets are a powerful pricing mechanism, share prices reflect investor sentiment, not just underlying business performance. One flawed but reasonable way to assess how sentiment around a company has changed is to compare the earnings per share (EPS) with the share price.
虽然市场是一种强大的定价机制,但股价反映了投资者的情绪,而不仅仅是潜在的业务表现。评估公司情绪变化的一种有缺陷但合理的方法是将每股收益(EPS)与股价进行比较。
During the unfortunate three years of share price decline, Vector Group actually saw its earnings per share (EPS) improve by 4.8% per year. Given the share price reaction, one might suspect that EPS is not a good guide to the business performance during the period (perhaps due to a one-off loss or gain). Alternatively, growth expectations may have been unreasonable in the past.
在不幸的三年股价下跌中,Vector集团的每股收益(EPS)实际上每年增长4.8%。鉴于股价的反应,人们可能会怀疑每股收益并不能很好地指导该期间的业务表现(可能是由于一次性的亏损或收益)。或者,过去的增长预期可能不合理。
It's pretty reasonable to suspect the market was previously to bullish on the stock, and has since moderated expectations. However, taking a look at other business metrics might shed a bit more light on the share price action.
可以合理地怀疑市场此前曾看涨该股,此后又放缓了预期。但是,看看其他业务指标可能会为股价走势提供更多启示。
We note that the dividend seems healthy enough, so that probably doesn't explain the share price drop. We like that Vector Group has actually grown its revenue over the last three years. If the company can keep growing revenue, there may be an opportunity for investors. You might have to dig deeper to understand the recent share price weakness.
我们注意到,股息似乎足够健康,因此这可能无法解释股价下跌的原因。我们喜欢Vector Group,在过去三年中,其收入实际上有所增长。如果公司能够保持收入增长,那么投资者可能会有机会。你可能需要更深入地挖掘才能了解最近的股价疲软。
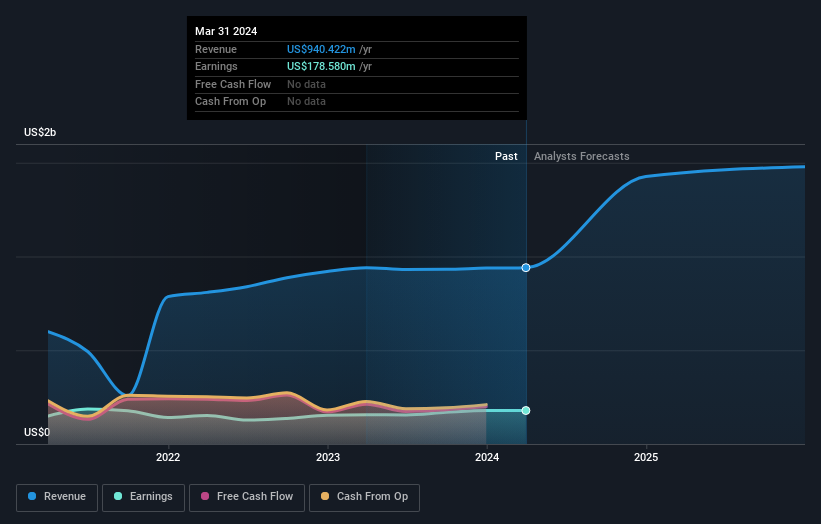
The graphic below depicts how earnings and revenue have changed over time (unveil the exact values by clicking on the image).
下图描述了收入和收入随时间推移而发生的变化(点击图片即可显示确切的数值)。
We like that insiders have been buying shares in the last twelve months. Having said that, most people consider earnings and revenue growth trends to be a more meaningful guide to the business. So we recommend checking out this free report showing consensus forecasts
我们喜欢内部人士在过去十二个月中一直在购买股票。话虽如此,大多数人认为收益和收入增长趋势是更有意义的业务指南。因此,我们建议您查看这份显示共识预测的免费报告
What About Dividends?
分红呢?
It is important to consider the total shareholder return, as well as the share price return, for any given stock. The TSR is a return calculation that accounts for the value of cash dividends (assuming that any dividend received was reinvested) and the calculated value of any discounted capital raisings and spin-offs. Arguably, the TSR gives a more comprehensive picture of the return generated by a stock. As it happens, Vector Group's TSR for the last 3 years was 17%, which exceeds the share price return mentioned earlier. And there's no prize for guessing that the dividend payments largely explain the divergence!
重要的是要考虑任何给定股票的股东总回报率和股价回报率。股东总回报率是一种回报计算方法,它考虑了现金分红的价值(假设收到的任何股息都经过再投资)以及任何贴现资本筹集和分拆的计算价值。可以说,股东总回报率更全面地描述了股票产生的回报。碰巧的是,矢量集团过去3年的股东总回报率为17%,超过了前面提到的股价回报率。而且,猜测股息支付在很大程度上解释了这种分歧是没有好处的!
A Different Perspective
不同的视角
Investors in Vector Group had a tough year, with a total loss of 18% (including dividends), against a market gain of about 26%. However, keep in mind that even the best stocks will sometimes underperform the market over a twelve month period. On the bright side, long term shareholders have made money, with a gain of 16% per year over half a decade. It could be that the recent sell-off is an opportunity, so it may be worth checking the fundamental data for signs of a long term growth trend. While it is well worth considering the different impacts that market conditions can have on the share price, there are other factors that are even more important. Case in point: We've spotted 3 warning signs for Vector Group you should be aware of, and 2 of them are potentially serious.
Vector集团的投资者经历了艰难的一年,总亏损了18%(包括股息),而市场涨幅约为26%。但是,请记住,即使是最好的股票有时也会在十二个月内表现不如市场。好的一面是,长期股东赚了钱,在过去的五年中,每年增长16%。最近的抛售可能是一个机会,因此可能值得查看基本面数据以寻找长期增长趋势的迹象。尽管市场状况可能对股价产生的不同影响值得考虑,但还有其他因素更为重要。一个很好的例子:我们已经发现了你应该注意的 Vector Group 的 3 个警告信号,其中 2 个可能很严重。
There are plenty of other companies that have insiders buying up shares. You probably do not want to miss this free list of growing companies that insiders are buying.
还有很多其他公司有内部人士购买股票。你可能不想错过这份业内人士正在收购的成长型公司的免费名单。
Please note, the market returns quoted in this article reflect the market weighted average returns of stocks that currently trade on American exchanges.
请注意,本文引用的市场回报反映了目前在美国交易所交易的股票的市场加权平均回报。
Have feedback on this article? Concerned about the content? Get in touch with us directly. Alternatively, email editorial-team (at) simplywallst.com.
This article by Simply Wall St is general in nature. We provide commentary based on historical data and analyst forecasts only using an unbiased methodology and our articles are not intended to be financial advice. It does not constitute a recommendation to buy or sell any stock, and does not take account of your objectives, or your financial situation. We aim to bring you long-term focused analysis driven by fundamental data. Note that our analysis may not factor in the latest price-sensitive company announcements or qualitative material. Simply Wall St has no position in any stocks mentioned.
对这篇文章有反馈吗?对内容感到担忧?直接联系我们。 或者,给编辑团队 (at) simplywallst.com 发送电子邮件。
Simply Wall St的这篇文章本质上是笼统的。我们仅使用公正的方法根据历史数据和分析师的预测提供评论,我们的文章无意作为财务建议。它不构成买入或卖出任何股票的建议,也没有考虑到您的目标或财务状况。我们的目标是为您提供由基本数据驱动的长期重点分析。请注意,我们的分析可能不考虑最新的价格敏感型公司公告或定性材料。简而言之,华尔街没有持有任何上述股票的头寸。
译文内容由第三方软件翻译。