
Unfortunately for some shareholders, the Kaixin Holdings (NASDAQ:KXIN) share price has dived 26% in the last thirty days, prolonging recent pain. The recent drop completes a disastrous twelve months for shareholders, who are sitting on a 97% loss during that time.
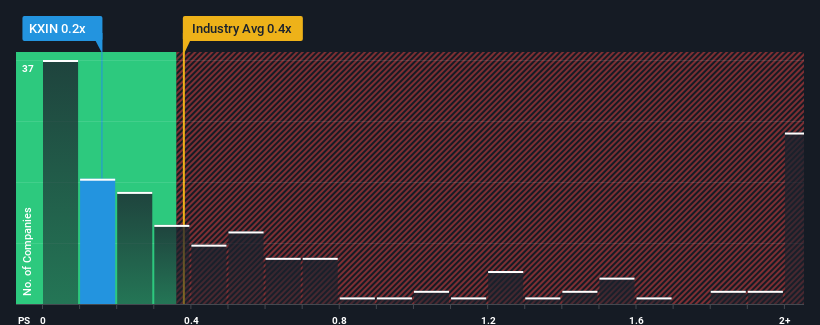
Although its price has dipped substantially, it's still not a stretch to say that Kaixin Holdings' price-to-sales (or "P/S") ratio of 0.2x right now seems quite "middle-of-the-road" compared to the Specialty Retail industry in the United States, where the median P/S ratio is around 0.4x. However, investors might be overlooking a clear opportunity or potential setback if there is no rational basis for the P/S.
What Does Kaixin Holdings' Recent Performance Look Like?
For example, consider that Kaixin Holdings' financial performance has been poor lately as its revenue has been in decline. One possibility is that the P/S is moderate because investors think the company might still do enough to be in line with the broader industry in the near future. If you like the company, you'd at least be hoping this is the case so that you could potentially pick up some stock while it's not quite in favour.
We don't have analyst forecasts, but you can see how recent trends are setting up the company for the future by checking out our free report on Kaixin Holdings' earnings, revenue and cash flow.Do Revenue Forecasts Match The P/S Ratio?
In order to justify its P/S ratio, Kaixin Holdings would need to produce growth that's similar to the industry.
In reviewing the last year of financials, we were disheartened to see the company's revenues fell to the tune of 62%. Spectacularly, three year revenue growth has ballooned by several orders of magnitude, despite the drawbacks experienced in the last 12 months. Therefore, it's fair to say the revenue growth recently has been superb for the company, but investors will want to ask why it is now in decline.
Comparing that recent medium-term revenue trajectory with the industry's one-year growth forecast of 3.7% shows it's noticeably more attractive.
In light of this, it's curious that Kaixin Holdings' P/S sits in line with the majority of other companies. Apparently some shareholders believe the recent performance is at its limits and have been accepting lower selling prices.
The Bottom Line On Kaixin Holdings' P/S
Following Kaixin Holdings' share price tumble, its P/S is just clinging on to the industry median P/S. We'd say the price-to-sales ratio's power isn't primarily as a valuation instrument but rather to gauge current investor sentiment and future expectations.
We've established that Kaixin Holdings currently trades on a lower than expected P/S since its recent three-year growth is higher than the wider industry forecast. There could be some unobserved threats to revenue preventing the P/S ratio from matching this positive performance. At least the risk of a price drop looks to be subdued if recent medium-term revenue trends continue, but investors seem to think future revenue could see some volatility.
Having said that, be aware Kaixin Holdings is showing 4 warning signs in our investment analysis, and 3 of those are concerning.
Of course, profitable companies with a history of great earnings growth are generally safer bets. So you may wish to see this free collection of other companies that have reasonable P/E ratios and have grown earnings strongly.
Have feedback on this article? Concerned about the content? Get in touch with us directly. Alternatively, email editorial-team (at) simplywallst.com.
This article by Simply Wall St is general in nature. We provide commentary based on historical data and analyst forecasts only using an unbiased methodology and our articles are not intended to be financial advice. It does not constitute a recommendation to buy or sell any stock, and does not take account of your objectives, or your financial situation. We aim to bring you long-term focused analysis driven by fundamental data. Note that our analysis may not factor in the latest price-sensitive company announcements or qualitative material. Simply Wall St has no position in any stocks mentioned.