
 Yahoo Finance
 Returns At YHI International (SGX:BPF) Appear To Be Weighed Down
If you're not sure where to start when looking for the next multi-bagger, there are a few key trends you should keep an eye out for. Ideally, a business will show two trends; firstly a growing return on capital employed (ROCE) and secondly, an increasing amount of capital employed. Basically this means that a company has profitable initiatives that it can continue to reinvest in, which is a trait of a compounding machine. In light of that, when we looked at YHI International (SGX:BPF) and its ROCE trend, we weren't exactly thrilled.
What Is Return On Capital Employed (ROCE)?
For those who don't know, ROCE is a measure of a company's yearly pre-tax profit (its return), relative to the capital employed in the business. Analysts use this formula to calculate it for YHI International:
Return on Capital Employed = Earnings Before Interest and Tax (EBIT) ÷ (Total Assets - Current Liabilities)
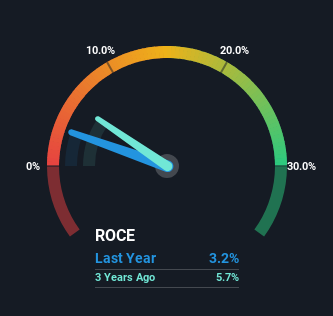
0.032 = S$10.0m ÷ (S$391m - S$83m) (Based on the trailing twelve months to December 2023).
Therefore, YHI International has an ROCE of 3.2%. In absolute terms, that's a low return and it also under-performs the Retail Distributors industry average of 6.6%.
Check out our latest analysis for YHI International
While the past is not representative of the future, it can be helpful to know how a company has performed historically, which is why we have this chart above. If you're interested in investigating YHI International's past further, check out this free graph covering YHI International's past earnings, revenue and cash flow.
What The Trend Of ROCE Can Tell Us
There hasn't been much to report for YHI International's returns and its level of capital employed because both metrics have been steady for the past five years. It's not uncommon to see this when looking at a mature and stable business that isn't re-investing its earnings because it has likely passed that phase of the business cycle. So unless we see a substantial change at YHI International in terms of ROCE and additional investments being made, we wouldn't hold our breath on it being a multi-bagger.
The Bottom Line
We can conclude that in regards to YHI International's returns on capital employed and the trends, there isn't much change to report on. Although the market must be expecting these trends to improve because the stock has gained 70% over the last five years. Ultimately, if the underlying trends persist, we wouldn't hold our breath on it being a multi-bagger going forward.
Like most companies, YHI International does come with some risks, and we've found 1 warning sign that you should be aware of.
While YHI International isn't earning the highest return, check out this free list of companies that are earning high returns on equity with solid balance sheets.
Have feedback on this article? Concerned about the content? Get in touch with us directly. Alternatively, email editorial-team (at) simplywallst.com.
This article by Simply Wall St is general in nature. We provide commentary based on historical data and analyst forecasts only using an unbiased methodology and our articles are not intended to be financial advice. It does not constitute a recommendation to buy or sell any stock, and does not take account of your objectives, or your financial situation. We aim to bring you long-term focused analysis driven by fundamental data. Note that our analysis may not factor in the latest price-sensitive company announcements or qualitative material. Simply Wall St has no position in any stocks mentioned.
