
Investors in Abbott Laboratories (NYSE:ABT) Have Seen Respectable Returns of 48% Over the Past Five Years
Investors in Abbott Laboratories (NYSE:ABT) Have Seen Respectable Returns of 48% Over the Past Five Years
If you buy and hold a stock for many years, you'd hope to be making a profit. But more than that, you probably want to see it rise more than the market average. Unfortunately for shareholders, while the Abbott Laboratories (NYSE:ABT) share price is up 36% in the last five years, that's less than the market return. Unfortunately the share price is down 3.2% in the last year.
如果你买入并持有股票多年,你希望获利。但不仅如此,你可能希望看到它的涨幅超过市场平均水平。对于股东来说,不幸的是,尽管雅培实验室(纽约证券交易所代码:ABT)的股价在过去五年中上涨了36%,但仍低于市场回报率。不幸的是,去年股价下跌了3.2%。
Let's take a look at the underlying fundamentals over the longer term, and see if they've been consistent with shareholders returns.
让我们来看看长期的基本面,看看它们是否与股东的回报一致。
There is no denying that markets are sometimes efficient, but prices do not always reflect underlying business performance. One flawed but reasonable way to assess how sentiment around a company has changed is to compare the earnings per share (EPS) with the share price.
不可否认,市场有时是有效的,但价格并不总是能反映潜在的业务表现。评估公司情绪变化的一种有缺陷但合理的方法是将每股收益(EPS)与股价进行比较。
During five years of share price growth, Abbott Laboratories achieved compound earnings per share (EPS) growth of 17% per year. This EPS growth is higher than the 6% average annual increase in the share price. Therefore, it seems the market has become relatively pessimistic about the company.
在五年的股价增长中,雅培实验室实现了每年17%的复合每股收益(EPS)增长。每股收益的增长高于股价年均增长6%。因此,市场似乎对该公司变得相对悲观。
The company's earnings per share (over time) is depicted in the image below (click to see the exact numbers).
该公司的每股收益(随着时间的推移)如下图所示(点击查看确切数字)。
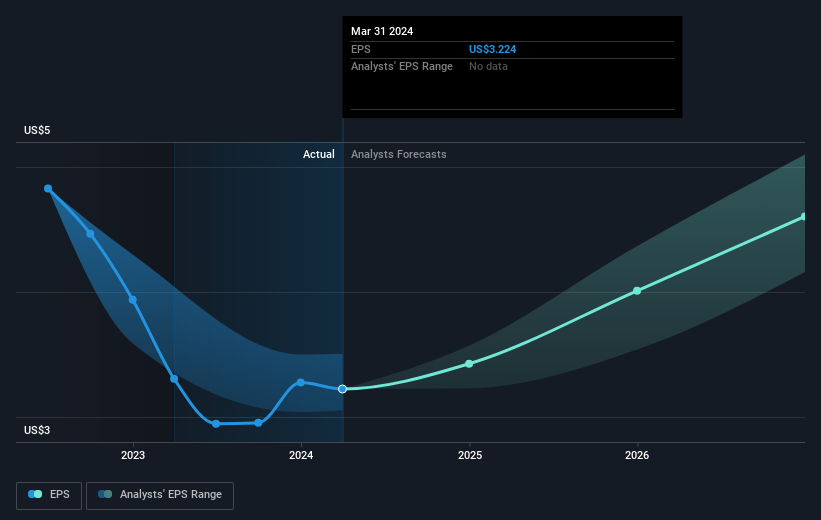
Dive deeper into Abbott Laboratories' key metrics by checking this interactive graph of Abbott Laboratories's earnings, revenue and cash flow.
查看这张雅培实验室收益、收入和现金流的交互式图表,深入了解雅培实验室的关键指标。
What About Dividends?
分红呢?
It is important to consider the total shareholder return, as well as the share price return, for any given stock. The TSR incorporates the value of any spin-offs or discounted capital raisings, along with any dividends, based on the assumption that the dividends are reinvested. Arguably, the TSR gives a more comprehensive picture of the return generated by a stock. We note that for Abbott Laboratories the TSR over the last 5 years was 48%, which is better than the share price return mentioned above. And there's no prize for guessing that the dividend payments largely explain the divergence!
重要的是要考虑任何给定股票的股东总回报率和股价回报率。基于股息再投资的假设,股东总回报率纳入了任何分拆或贴现资本筹集的价值以及任何股息。可以说,股东总回报率更全面地描述了股票产生的回报。我们注意到,雅培实验室过去5年的股东总回报率为48%,好于上述股价回报率。而且,猜测股息支付在很大程度上解释了这种分歧是没有好处的!
A Different Perspective
不同的视角
Investors in Abbott Laboratories had a tough year, with a total loss of 1.3% (including dividends), against a market gain of about 24%. Even the share prices of good stocks drop sometimes, but we want to see improvements in the fundamental metrics of a business, before getting too interested. On the bright side, long term shareholders have made money, with a gain of 8% per year over half a decade. It could be that the recent sell-off is an opportunity, so it may be worth checking the fundamental data for signs of a long term growth trend. Most investors take the time to check the data on insider transactions. You can click here to see if insiders have been buying or selling.
雅培实验室的投资者经历了艰难的一年,总亏损为1.3%(包括股息),而市场涨幅约为24%。即使是优质股票的股价有时也会下跌,但我们希望在过于感兴趣之前看到企业基本指标的改善。好的一面是,长期股东赚了钱,在过去的五年中,每年增长8%。最近的抛售可能是一个机会,因此可能值得查看基本面数据以寻找长期增长趋势的迹象。大多数投资者花时间检查内幕交易数据。您可以点击此处查看内部人士是否在买入或卖出。
But note: Abbott Laboratories may not be the best stock to buy. So take a peek at this free list of interesting companies with past earnings growth (and further growth forecast).
但请注意:雅培实验室可能不是最值得购买的股票。因此,来看看这份过去盈利增长(以及进一步增长预测)的有趣公司的免费清单。
Please note, the market returns quoted in this article reflect the market weighted average returns of stocks that currently trade on American exchanges.
请注意,本文引用的市场回报反映了目前在美国交易所交易的股票的市场加权平均回报。
Have feedback on this article? Concerned about the content? Get in touch with us directly. Alternatively, email editorial-team (at) simplywallst.com.
This article by Simply Wall St is general in nature. We provide commentary based on historical data and analyst forecasts only using an unbiased methodology and our articles are not intended to be financial advice. It does not constitute a recommendation to buy or sell any stock, and does not take account of your objectives, or your financial situation. We aim to bring you long-term focused analysis driven by fundamental data. Note that our analysis may not factor in the latest price-sensitive company announcements or qualitative material. Simply Wall St has no position in any stocks mentioned.
对这篇文章有反馈吗?对内容感到担忧?直接联系我们。 或者,给编辑团队 (at) simplywallst.com 发送电子邮件。
Simply Wall St的这篇文章本质上是笼统的。我们仅使用公正的方法根据历史数据和分析师的预测提供评论,我们的文章无意作为财务建议。它不构成买入或卖出任何股票的建议,也没有考虑到您的目标或财务状况。我们的目标是为您提供由基本数据驱动的长期重点分析。请注意,我们的分析可能不考虑最新的价格敏感型公司公告或定性材料。简而言之,华尔街没有持有任何上述股票的头寸。
译文内容由第三方软件翻译。