
Could The Market Be Wrong About W. R. Berkley Corporation (NYSE:WRB) Given Its Attractive Financial Prospects?
Could The Market Be Wrong About W. R. Berkley Corporation (NYSE:WRB) Given Its Attractive Financial Prospects?
W. R. Berkley (NYSE:WRB) has had a rough month with its share price down 13%. But if you pay close attention, you might gather that its strong financials could mean that the stock could potentially see an increase in value in the long-term, given how markets usually reward companies with good financial health. Particularly, we will be paying attention to W. R. Berkley's ROE today.
W.R. Berkley(紐約證券交易所代碼:WRB)經歷了艱難的一個月,其股價下跌了13%。但是,如果你密切關注,你可能會發現,鑑於市場通常會獎勵財務狀況良好的公司,其強勁的財務狀況可能意味着該股的長期價值可能會增加。特別是,我們今天將關注W.R. Berkley的投資回報率。
Return on equity or ROE is a key measure used to assess how efficiently a company's management is utilizing the company's capital. In simpler terms, it measures the profitability of a company in relation to shareholder's equity.
股本回報率或投資回報率是用於評估公司管理層利用公司資本效率的關鍵指標。簡而言之,它衡量公司相對於股東權益的盈利能力。
How To Calculate Return On Equity?
如何計算股本回報率?
ROE can be calculated by using the formula:
ROE 可以通過以下公式計算:
Return on Equity = Net Profit (from continuing operations) ÷ Shareholders' Equity
股本回報率 = 淨利潤(來自持續經營業務)÷ 股東權益
So, based on the above formula, the ROE for W. R. Berkley is:
因此,根據上述公式,W.R. Berkley的投資回報率爲:
20% = US$1.5b ÷ US$7.5b (Based on the trailing twelve months to March 2024).
20% = 15億美元 ÷ 75億美元(基於截至2024年3月的過去十二個月)。
The 'return' is the income the business earned over the last year. Another way to think of that is that for every $1 worth of equity, the company was able to earn $0.20 in profit.
“回報” 是企業在過去一年中獲得的收入。另一種思考方式是,每持有價值1美元的股權,該公司就能獲得0.20美元的利潤。
What Is The Relationship Between ROE And Earnings Growth?
投資回報率與收益增長之間有什麼關係?
We have already established that ROE serves as an efficient profit-generating gauge for a company's future earnings. Depending on how much of these profits the company reinvests or "retains", and how effectively it does so, we are then able to assess a company's earnings growth potential. Generally speaking, other things being equal, firms with a high return on equity and profit retention, have a higher growth rate than firms that don't share these attributes.
我們已經確定,投資回報率是衡量公司未來收益的有效盈利指標。然後,我們能夠評估公司的收益增長潛力,具體取決於公司對這些利潤進行再投資或 “保留” 了多少及其有效性。一般而言,在其他條件相同的情況下,股本回報率和利潤留存率高的公司的增長率要高於不具有這些屬性的公司。
A Side By Side comparison of W. R. Berkley's Earnings Growth And 20% ROE
W.R. Berkley的收益增長和20%的投資回報率的並排比較
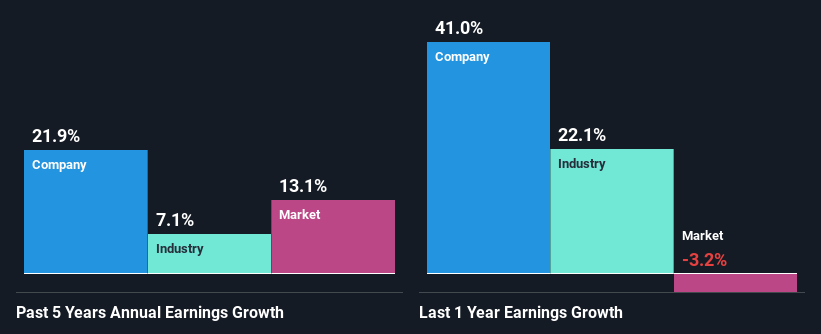
To start with, W. R. Berkley's ROE looks acceptable. Further, the company's ROE compares quite favorably to the industry average of 13%. This certainly adds some context to W. R. Berkley's exceptional 22% net income growth seen over the past five years. We reckon that there could also be other factors at play here. For example, it is possible that the company's management has made some good strategic decisions, or that the company has a low payout ratio.
首先,W.R. Berkley的投資回報率似乎可以接受。此外,該公司的投資回報率與行業平均水平的13%相比相當不錯。這無疑爲W.R. Berkley在過去五年中驚人的22%淨收入增長增添了一些背景信息。我們認爲,這裏可能還有其他因素在起作用。例如,公司的管理層可能做出了一些良好的戰略決策,或者公司的派息率很低。
We then compared W. R. Berkley's net income growth with the industry and we're pleased to see that the company's growth figure is higher when compared with the industry which has a growth rate of 7.1% in the same 5-year period.
然後,我們將W.R. Berkley的淨收入增長與該行業進行了比較,我們很高興地看到,與同期5年同期增長率爲7.1%的行業相比,該公司的增長數字更高。
Earnings growth is an important metric to consider when valuing a stock. What investors need to determine next is if the expected earnings growth, or the lack of it, is already built into the share price. Doing so will help them establish if the stock's future looks promising or ominous. If you're wondering about W. R. Berkley's's valuation, check out this gauge of its price-to-earnings ratio, as compared to its industry.
收益增長是對股票進行估值時要考慮的重要指標。投資者接下來需要確定的是,預期的收益增長或缺乏收益是否已經包含在股價中。這樣做將幫助他們確定股票的未來是樂觀還是不祥的。如果你想知道W.R. Berkley的估值,可以看看這個衡量其與行業相比的市盈率指標。
Is W. R. Berkley Making Efficient Use Of Its Profits?
W.R. Berkley 是否在有效利用其利潤?
W. R. Berkley's ' three-year median payout ratio is on the lower side at 8.4% implying that it is retaining a higher percentage (92%) of its profits. So it looks like W. R. Berkley is reinvesting profits heavily to grow its business, which shows in its earnings growth.
W. R. Berkley的三年派息率中位數處於較低水平,爲8.4%,這意味着它保留了更高的利潤百分比(92%)。因此,看來W.R. Berkley正在大量再投資利潤以發展其業務,這體現在其收益增長上。
Moreover, W. R. Berkley is determined to keep sharing its profits with shareholders which we infer from its long history of paying a dividend for at least ten years. Looking at the current analyst consensus data, we can see that the company's future payout ratio is expected to rise to 28% over the next three years. Despite the higher expected payout ratio, the company's ROE is not expected to change by much.
此外,W.R. Berkley決心繼續與股東分享利潤,這是我們從其支付股息的長期歷史中推斷出來的。從目前的分析師共識數據來看,我們可以看出,該公司的未來派息率預計將在未來三年內升至28%。儘管預期派息率更高,但該公司的投資回報率預計不會有太大變化。
Conclusion
結論
In total, we are pretty happy with W. R. Berkley's performance. Particularly, we like that the company is reinvesting heavily into its business, and at a high rate of return. Unsurprisingly, this has led to an impressive earnings growth. With that said, the latest industry analyst forecasts reveal that the company's earnings growth is expected to slow down. To know more about the company's future earnings growth forecasts take a look at this free report on analyst forecasts for the company to find out more.
總的來說,我們對W.R. Berkley的表現非常滿意。特別是,我們喜歡該公司對其業務進行大量再投資,而且回報率很高。毫不奇怪,這帶來了令人印象深刻的收益增長。話雖如此,最新的行業分析師預測顯示,該公司的收益增長預計將放緩。要了解有關公司未來收益增長預測的更多信息,請查看這份關於分析師預測的免費報告,以了解更多信息。
Have feedback on this article? Concerned about the content? Get in touch with us directly. Alternatively, email editorial-team (at) simplywallst.com.
This article by Simply Wall St is general in nature. We provide commentary based on historical data and analyst forecasts only using an unbiased methodology and our articles are not intended to be financial advice. It does not constitute a recommendation to buy or sell any stock, and does not take account of your objectives, or your financial situation. We aim to bring you long-term focused analysis driven by fundamental data. Note that our analysis may not factor in the latest price-sensitive company announcements or qualitative material. Simply Wall St has no position in any stocks mentioned.
對這篇文章有反饋嗎?對內容感到擔憂?直接聯繫我們。 或者,給編輯團隊 (at) simplywallst.com 發送電子郵件。
Simply Wall St的這篇文章本質上是籠統的。我們僅使用公正的方法根據歷史數據和分析師的預測提供評論,我們的文章無意作爲財務建議。它不構成買入或賣出任何股票的建議,也沒有考慮到您的目標或財務狀況。我們的目標是爲您提供由基本數據驅動的長期重點分析。請注意,我們的分析可能不考慮最新的價格敏感型公司公告或定性材料。簡而言之,華爾街沒有持有任何上述股票的頭寸。
譯文內容由第三人軟體翻譯。