
Investors in ManpowerGroup (NYSE:MAN) Have Unfortunately Lost 32% Over the Last Three Years
Investors in ManpowerGroup (NYSE:MAN) Have Unfortunately Lost 32% Over the Last Three Years
In order to justify the effort of selecting individual stocks, it's worth striving to beat the returns from a market index fund. But in any portfolio, there are likely to be some stocks that fall short of that benchmark. Unfortunately, that's been the case for longer term ManpowerGroup Inc. (NYSE:MAN) shareholders, since the share price is down 38% in the last three years, falling well short of the market return of around 13%.
爲了證明選擇個股的努力是合理的,值得努力超過市場指數基金的回報。但是在任何投資組合中,都可能有一些股票未達到該基準。不幸的是,ManpowerGroup Inc.(紐約證券交易所代碼:MAN)的長期股東就是這種情況,因爲股價在過去三年中下跌了38%,遠低於13%左右的市場回報率。
With that in mind, it's worth seeing if the company's underlying fundamentals have been the driver of long term performance, or if there are some discrepancies.
考慮到這一點,值得一看公司的基本面是否是長期業績的驅動力,或者是否存在一些差異。
To quote Buffett, 'Ships will sail around the world but the Flat Earth Society will flourish. There will continue to be wide discrepancies between price and value in the marketplace...' One imperfect but simple way to consider how the market perception of a company has shifted is to compare the change in the earnings per share (EPS) with the share price movement.
引用巴菲特的話說:“船隻將在世界各地航行,但Flat Earth Society將蓬勃發展。市場上的價格和價值之間將繼續存在巨大差異...”考慮市場對公司的看法發生了怎樣的變化的一種不完美但簡單的方法是將每股收益(EPS)的變化與股價走勢進行比較。
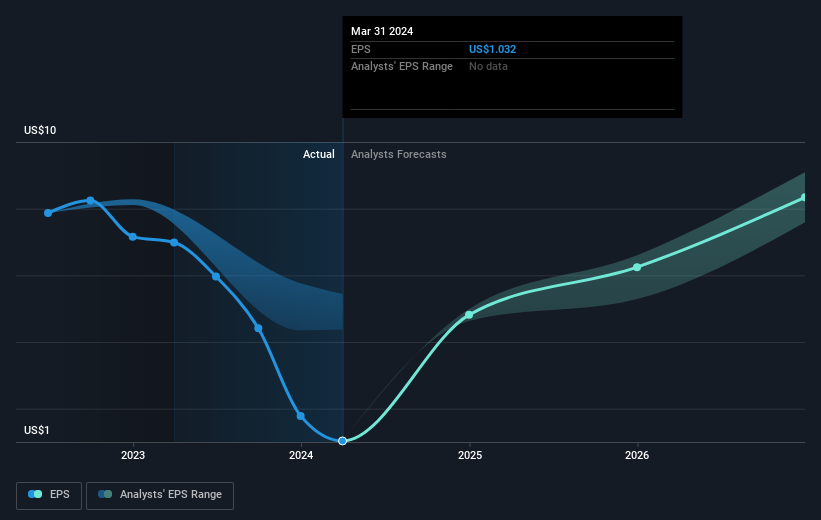
ManpowerGroup saw its EPS decline at a compound rate of 11% per year, over the last three years. The share price decline of 15% is actually steeper than the EPS slippage. So it seems the market was too confident about the business, in the past. Of course, with a P/E ratio of 72.70, the market remains optimistic.
在過去三年中,萬寶盛華集團的每股收益以每年11%的複合速度下降。15%的股價下跌實際上比每股收益的下滑幅度更大。因此,過去市場似乎對該業務過於自信。當然,市盈率爲72.70,市場仍然樂觀。
The company's earnings per share (over time) is depicted in the image below (click to see the exact numbers).
該公司的每股收益(隨着時間的推移)如下圖所示(點擊查看確切數字)。
Before buying or selling a stock, we always recommend a close examination of historic growth trends, available here.
在買入或賣出股票之前,我們始終建議仔細研究歷史增長趨勢,可在此處查閱。
What About Dividends?
分紅呢?
As well as measuring the share price return, investors should also consider the total shareholder return (TSR). The TSR incorporates the value of any spin-offs or discounted capital raisings, along with any dividends, based on the assumption that the dividends are reinvested. So for companies that pay a generous dividend, the TSR is often a lot higher than the share price return. We note that for ManpowerGroup the TSR over the last 3 years was -32%, which is better than the share price return mentioned above. The dividends paid by the company have thusly boosted the total shareholder return.
除了衡量股價回報率外,投資者還應考慮股東總回報率(TSR)。基於股息再投資的假設,股東總回報率納入了任何分拆或貼現資本籌集的價值以及任何股息。因此,對於支付豐厚股息的公司來說,股東總回報率通常遠高於股價回報率。我們注意到,萬寶集團過去三年的股東總回報率爲-32%,好於上述股價回報率。因此,該公司支付的股息提高了 總 股東回報。
A Different Perspective
不同的視角
ManpowerGroup provided a TSR of 6.7% over the last twelve months. But that was short of the market average. On the bright side, that's still a gain, and it is certainly better than the yearly loss of about 1.3% endured over half a decade. So this might be a sign the business has turned its fortunes around. While it is well worth considering the different impacts that market conditions can have on the share price, there are other factors that are even more important. Case in point: We've spotted 3 warning signs for ManpowerGroup you should be aware of.
在過去的十二個月中,萬寶盛華集團的股東回報率爲6.7%。但這低於市場平均水平。好的一面是,這仍然是一個收益,而且肯定比五年來持續的約1.3%的年度虧損要好。因此,這可能表明該企業已經扭轉了命運。儘管市場狀況可能對股價產生的不同影響值得考慮,但還有其他因素更爲重要。一個很好的例子:我們已經發現了萬寶集團的3個警告信號,你應該注意了。
Of course ManpowerGroup may not be the best stock to buy. So you may wish to see this free collection of growth stocks.
當然,萬寶盛華集團可能不是最值得購買的股票。因此,您可能希望看到這批免費的成長股。
Please note, the market returns quoted in this article reflect the market weighted average returns of stocks that currently trade on American exchanges.
請注意,本文引用的市場回報反映了目前在美國交易所交易的股票的市場加權平均回報。
Have feedback on this article? Concerned about the content? Get in touch with us directly. Alternatively, email editorial-team (at) simplywallst.com.
This article by Simply Wall St is general in nature. We provide commentary based on historical data and analyst forecasts only using an unbiased methodology and our articles are not intended to be financial advice. It does not constitute a recommendation to buy or sell any stock, and does not take account of your objectives, or your financial situation. We aim to bring you long-term focused analysis driven by fundamental data. Note that our analysis may not factor in the latest price-sensitive company announcements or qualitative material. Simply Wall St has no position in any stocks mentioned.
對這篇文章有反饋嗎?對內容感到擔憂?直接聯繫我們。 或者,給編輯團隊 (at) simplywallst.com 發送電子郵件。
Simply Wall St的這篇文章本質上是籠統的。我們僅使用公正的方法根據歷史數據和分析師的預測提供評論,我們的文章無意作爲財務建議。它不構成買入或賣出任何股票的建議,也沒有考慮到您的目標或財務狀況。我們的目標是爲您提供由基本數據驅動的長期重點分析。請注意,我們的分析可能不考慮最新的價格敏感型公司公告或定性材料。簡而言之,華爾街沒有持有任何上述股票的頭寸。
譯文內容由第三人軟體翻譯。