
Are Investors Undervaluing SIA Engineering Company Limited (SGX:S59) By 26%?
Are Investors Undervaluing SIA Engineering Company Limited (SGX:S59) By 26%?
Key Insights
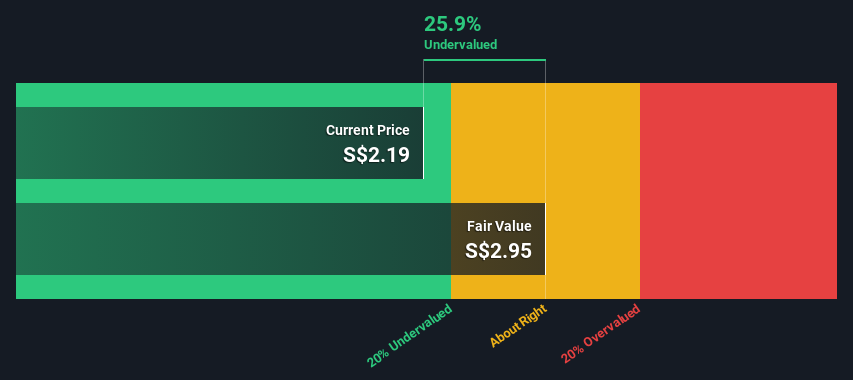
- Using the 2 Stage Free Cash Flow to Equity, SIA Engineering fair value estimate is S$2.95
- SIA Engineering is estimated to be 26% undervalued based on current share price of S$2.19
- Our fair value estimate is 9.2% higher than SIA Engineering's analyst price target of S$2.71
Today we will run through one way of estimating the intrinsic value of SIA Engineering Company Limited (SGX:S59) by taking the expected future cash flows and discounting them to today's value. Our analysis will employ the Discounted Cash Flow (DCF) model. Before you think you won't be able to understand it, just read on! It's actually much less complex than you'd imagine.
Remember though, that there are many ways to estimate a company's value, and a DCF is just one method. If you still have some burning questions about this type of valuation, take a look at the Simply Wall St analysis model.
The Method
We're using the 2-stage growth model, which simply means we take in account two stages of company's growth. In the initial period the company may have a higher growth rate and the second stage is usually assumed to have a stable growth rate. To begin with, we have to get estimates of the next ten years of cash flows. Where possible we use analyst estimates, but when these aren't available we extrapolate the previous free cash flow (FCF) from the last estimate or reported value. We assume companies with shrinking free cash flow will slow their rate of shrinkage, and that companies with growing free cash flow will see their growth rate slow, over this period. We do this to reflect that growth tends to slow more in the early years than it does in later years.
A DCF is all about the idea that a dollar in the future is less valuable than a dollar today, so we need to discount the sum of these future cash flows to arrive at a present value estimate:
10-year free cash flow (FCF) estimate
| 2024 | 2025 | 2026 | 2027 | 2028 | 2029 | 2030 | 2031 | 2032 | 2033 | |
| Levered FCF (SGD, Millions) | S$134.5m | S$124.4m | S$139.6m | S$186.1m | S$200.3m | S$211.1m | S$220.3m | S$228.3m | S$235.6m | S$242.3m |
| Growth Rate Estimate Source | Analyst x2 | Analyst x2 | Analyst x2 | Analyst x1 | Analyst x1 | Est @ 5.35% | Est @ 4.36% | Est @ 3.67% | Est @ 3.18% | Est @ 2.84% |
| Present Value (SGD, Millions) Discounted @ 7.7% | S$125 | S$107 | S$112 | S$138 | S$138 | S$135 | S$131 | S$126 | S$121 | S$115 |
("Est" = FCF growth rate estimated by Simply Wall St)
Present Value of 10-year Cash Flow (PVCF) = S$1.2b
After calculating the present value of future cash flows in the initial 10-year period, we need to calculate the Terminal Value, which accounts for all future cash flows beyond the first stage. The Gordon Growth formula is used to calculate Terminal Value at a future annual growth rate equal to the 5-year average of the 10-year government bond yield of 2.1%. We discount the terminal cash flows to today's value at a cost of equity of 7.7%.
Terminal Value (TV)= FCF2033 × (1 + g) ÷ (r – g) = S$242m× (1 + 2.1%) ÷ (7.7%– 2.1%) = S$4.4b
Present Value of Terminal Value (PVTV)= TV / (1 + r)10= S$4.4b÷ ( 1 + 7.7%)10= S$2.1b
The total value is the sum of cash flows for the next ten years plus the discounted terminal value, which results in the Total Equity Value, which in this case is S$3.3b. In the final step we divide the equity value by the number of shares outstanding. Compared to the current share price of S$2.2, the company appears a touch undervalued at a 26% discount to where the stock price trades currently. Valuations are imprecise instruments though, rather like a telescope - move a few degrees and end up in a different galaxy. Do keep this in mind.
The Assumptions
Now the most important inputs to a discounted cash flow are the discount rate, and of course, the actual cash flows. Part of investing is coming up with your own evaluation of a company's future performance, so try the calculation yourself and check your own assumptions. The DCF also does not consider the possible cyclicality of an industry, or a company's future capital requirements, so it does not give a full picture of a company's potential performance. Given that we are looking at SIA Engineering as potential shareholders, the cost of equity is used as the discount rate, rather than the cost of capital (or weighted average cost of capital, WACC) which accounts for debt. In this calculation we've used 7.7%, which is based on a levered beta of 1.235. Beta is a measure of a stock's volatility, compared to the market as a whole. We get our beta from the industry average beta of globally comparable companies, with an imposed limit between 0.8 and 2.0, which is a reasonable range for a stable business.
SWOT Analysis for SIA Engineering
- Earnings growth over the past year exceeded the industry.
- Debt is not viewed as a risk.
- Balance sheet summary for S59.
- Dividend is low compared to the top 25% of dividend payers in the Infrastructure market.
- Annual earnings are forecast to grow faster than the Singaporean market.
- Trading below our estimate of fair value by more than 20%.
- Dividends are not covered by earnings and cashflows.
- Revenue is forecast to grow slower than 20% per year.
- See S59's dividend history.
Looking Ahead:
Valuation is only one side of the coin in terms of building your investment thesis, and it shouldn't be the only metric you look at when researching a company. It's not possible to obtain a foolproof valuation with a DCF model. Preferably you'd apply different cases and assumptions and see how they would impact the company's valuation. If a company grows at a different rate, or if its cost of equity or risk free rate changes sharply, the output can look very different. Why is the intrinsic value higher than the current share price? For SIA Engineering, we've put together three essential aspects you should assess:
- Financial Health: Does S59 have a healthy balance sheet? Take a look at our free balance sheet analysis with six simple checks on key factors like leverage and risk.
- Future Earnings: How does S59's growth rate compare to its peers and the wider market? Dig deeper into the analyst consensus number for the upcoming years by interacting with our free analyst growth expectation chart.
- Other High Quality Alternatives: Do you like a good all-rounder? Explore our interactive list of high quality stocks to get an idea of what else is out there you may be missing!
PS. The Simply Wall St app conducts a discounted cash flow valuation for every stock on the SGX every day. If you want to find the calculation for other stocks just search here.
Have feedback on this article? Concerned about the content? Get in touch with us directly. Alternatively, email editorial-team (at) simplywallst.com.
This article by Simply Wall St is general in nature. We provide commentary based on historical data and analyst forecasts only using an unbiased methodology and our articles are not intended to be financial advice. It does not constitute a recommendation to buy or sell any stock, and does not take account of your objectives, or your financial situation. We aim to bring you long-term focused analysis driven by fundamental data. Note that our analysis may not factor in the latest price-sensitive company announcements or qualitative material. Simply Wall St has no position in any stocks mentioned.
關鍵見解
- 使用兩階段自由現金流股本計算,新航工程的公允價值估計爲2.95新元
- 根據目前2.19新元的股價,SIA工程估計被低估了26%
- 我們的公允價值估計比新航工程的分析師目標股價2.71新元高9.2%
今天,我們將介紹一種估算新航工程有限公司(SGX: S59)內在價值的方法,即採用預期的未來現金流並將其折現爲今天的價值。我們的分析將採用貼現現金流(DCF)模型。在你認爲自己無法理解之前,請繼續閱讀!實際上,它沒有你想象的那麼複雜。
但請記住,估算公司價值的方法有很多,而差價合約只是一種方法。如果你對這種估值還有一些迫切的問題,可以看看 Simply Wall St 分析模型。
該方法
我們使用的是兩階段增長模型,這只是意味着我們考慮了公司增長的兩個階段。在初始階段,公司的增長率可能更高,而第二階段通常被認爲具有穩定的增長率。首先,我們必須估算出未來十年的現金流。在可能的情況下,我們會使用分析師的估計值,但是當這些估計值不可用時,我們會從最新的估計值或報告的價值中推斷出之前的自由現金流(FCF)。我們假設自由現金流萎縮的公司將減緩其萎縮速度,而自由現金流不斷增長的公司在此期間的增長率將放緩。我們這樣做是爲了反映早期增長的放緩幅度往往比後來的幾年更大。
差價合約完全是關於未來一美元的價值低於今天一美元的想法,因此我們需要對這些未來現金流的總和進行折現才能得出現值估計:
10 年自由現金流 (FCF) 估計
| 2024 | 2025 | 2026 | 2027 | 2028 | 2029 | 2030 | 2031 | 2032 | 2033 | |
| Levered FCF(新加坡元,百萬) | 134.5 億新元 | 1.244 億新元 | 1.396 億新元 | 1.861 億新元 | 200.3 億新元 | 2.111 億新元 | 2.203 億新元 | 2.283 億新元 | 2.356 億新元 | 242.3 億新元 |
| 增長率估算來源 | 分析師 x2 | 分析師 x2 | 分析師 x2 | 分析師 x1 | 分析師 x1 | Est @ 5.35% | Est @ 4.36% | 美國東部標準時間 @ 3.67% | 東部時間 @ 3.18% | Est @ 2.84% |
| 現值(新加坡元,百萬新元)折扣 @ 7.7% | 新幣 125 | 新幣 107 美元 | 新幣 112 美元 | 新幣 138 美元 | 新幣 138 美元 | 新幣 135 美元 | 新幣 131 美元 | 新幣 126 美元 | 新幣 121 美元 | 115 新元 |
(“Est” = Simply Wall St估計的FCF增長率)
10 年期現金流 (PVCF) 的現值 = 12 億新元
在計算了最初10年期未來現金流的現值之後,我們需要計算終端價值,該終端價值考慮了第一階段之後的所有未來現金流。Gordon Growth 公式用於按未來年增長率計算終端價值,該增長率等於10年期政府債券收益率的5年平均值2.1%。我們將終端現金流折現爲今天的價值,權益成本爲7.7%。
終端價值 (TV) = FCF2033 × (1 + g) ÷ (r — g) = 2.42億新元× (1 + 2.1%) ÷ (7.7% — 2.1%) = 44億新元
終端價值的現值 (PVTV) = 電視/ (1 + r)10= 4.4億新元÷ (1 + 7.7%)10= 21億新元
總價值是未來十年的現金流總額加上折後的終端價值,由此得出總權益價值,在本例中爲33億新元。在最後一步中,我們將股票價值除以已發行股票的數量。與目前的2.2新元股價相比,該公司的估值似乎略有低估,與目前股價相比折扣了26%。但是,估值是不精確的工具,就像望遠鏡一樣——移動幾度,最終進入另一個星系。請記住這一點。
假設
現在,貼現現金流的最重要輸入是貼現率,當然還有實際現金流。投資的一部分是自己對公司未來業績的評估,因此請自己嘗試計算並檢查自己的假設。DCF也沒有考慮一個行業可能的週期性,也沒有考慮公司未來的資本需求,因此它沒有全面反映公司的潛在表現。鑑於我們將SIA Engineering視爲潛在股東,因此使用權益成本作爲貼現率,而不是構成債務的資本成本(或加權平均資本成本,WACC)。在此計算中,我們使用了7.7%,這是基於1.235的槓桿測試版。Beta是衡量股票與整個市場相比波動性的指標。我們的測試版來自全球可比公司的行業平均貝塔值,設定在0.8到2.0之間,這是一個穩定的業務的合理範圍。
SIA 工程的 SWOT 分析
- 過去一年的收益增長超過了該行業。
- 債務不被視爲風險。
- S59 的資產負債表摘要。
- 與基礎設施市場前25%的股息支付者相比,股息較低。
- 預計年收入的增長速度將快於新加坡市場。
- 交易價格比我們估計的公允價值低20%以上。
- 股息不在收益和現金流的覆蓋範圍內。
- 預計收入每年增長將低於20%。
- 查看S59的股息歷史記錄。
展望未來:
就建立投資論點而言,估值只是硬幣的一面,它不應該是你在研究公司時唯一考慮的指標。使用DCF模型不可能獲得萬無一失的估值。最好你運用不同的案例和假設,看看它們將如何影響公司的估值。如果一家公司以不同的速度增長,或者其股本成本或無風險利率急劇變化,則產出可能會大不相同。爲什麼內在價值高於當前股價?對於 SIA 工程而言,我們彙總了您應該評估的三個基本方面:
- 財務狀況:S59的資產負債表是否良好?看看我們的免費資產負債表分析,其中包含對槓桿和風險等關鍵因素的六項簡單檢查。
- 未來收益:與同行和整個市場相比,S59的增長率如何?通過與我們的免費分析師增長預期圖表互動,深入了解未來幾年的分析師共識數字。
- 其他高質量的替代品:你喜歡一個優秀的全能選手嗎?瀏覽我們的高品質股票互動清單,了解您可能還會錯過什麼!
PS。Simply Wall St應用程序每天對新加坡交易所的每隻股票進行折扣現金流估值。如果您想找到其他股票的計算方法,請在此處搜索。
對這篇文章有反饋嗎?對內容感到擔憂?直接聯繫我們。 或者,給編輯團隊 (at) simplywallst.com 發送電子郵件。
Simply Wall St的這篇文章本質上是籠統的。我們僅使用公正的方法根據歷史數據和分析師的預測提供評論,我們的文章無意作爲財務建議。它不構成買入或賣出任何股票的建議,也沒有考慮到您的目標或財務狀況。我們的目標是爲您提供由基本數據驅動的長期重點分析。請注意,我們的分析可能不考慮最新的價格敏感型公司公告或定性材料。簡而言之,華爾街沒有持有任何上述股票的頭寸。
譯文內容由第三人軟體翻譯。
風險及免責聲明
- 分享到weixin
- 分享到qq
- 分享到facebook
- 分享到twitter
- 分享到微博
- 粘贴板
使用瀏覽器的分享功能,分享給你的好友吧