
Further Weakness as Suzhou MedicalSystem Technology (SHSE:603990) Drops 19% This Week, Taking Five-year Losses to 48%
Further Weakness as Suzhou MedicalSystem Technology (SHSE:603990) Drops 19% This Week, Taking Five-year Losses to 48%
The main aim of stock picking is to find the market-beating stocks. But even the best stock picker will only win with some selections. At this point some shareholders may be questioning their investment in Suzhou MedicalSystem Technology Co., Ltd. (SHSE:603990), since the last five years saw the share price fall 49%. And we doubt long term believers are the only worried holders, since the stock price has declined 36% over the last twelve months. Shareholders have had an even rougher run lately, with the share price down 24% in the last 90 days.
選股的主要目的是找到擊敗市場的股票。但是,即使是最好的選股者也只能通過以下方式獲勝 一些 選擇。此時,一些股東可能會質疑他們對蘇州醫療系統技術有限公司(SHSE: 603990)的投資,因爲在過去五年中,股價下跌了49%。我們懷疑長期信徒是唯一擔心的持有者,因爲股價在過去十二個月中下跌了36%。股東們最近的表現更加艱難,股價在過去90天中下跌了24%。
Given the past week has been tough on shareholders, let's investigate the fundamentals and see what we can learn.
鑑於過去一週對股東來說很艱難,讓我們調查一下基本面,看看我們能學到什麼。
In his essay The Superinvestors of Graham-and-Doddsville Warren Buffett described how share prices do not always rationally reflect the value of a business. One imperfect but simple way to consider how the market perception of a company has shifted is to compare the change in the earnings per share (EPS) with the share price movement.
在他的文章中 格雷厄姆和多茲維爾的超級投資者 禾倫·巴菲特描述了股價如何並不總是合理地反映企業的價值。考慮市場對公司的看法發生了怎樣的變化的一種不完美但簡單的方法是將每股收益(EPS)的變化與股價走勢進行比較。
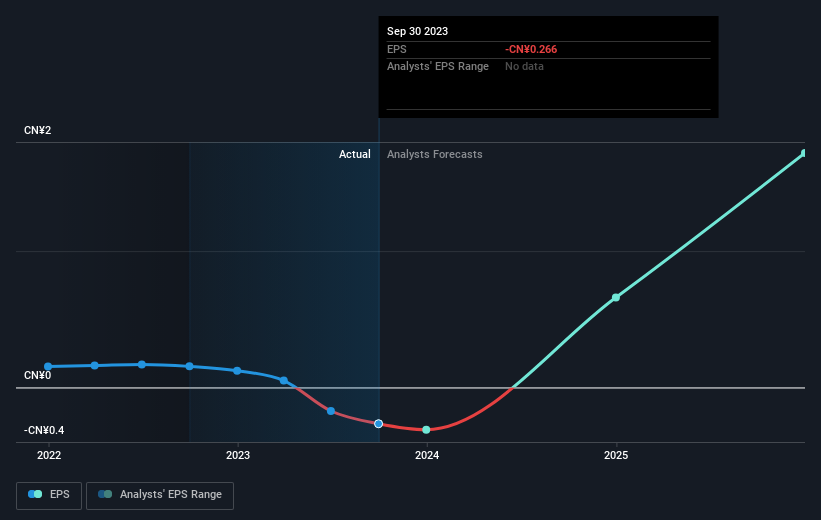
Over five years Suzhou MedicalSystem Technology's earnings per share dropped significantly, falling to a loss, with the share price also lower. At present it's hard to make valid comparisons between EPS and the share price. But we would generally expect a lower price, given the situation.
在過去的五年中,蘇州醫療系統科技的每股收益大幅下降,跌至虧損,股價也有所下降。目前,很難對每股收益和股價進行有效的比較。但是,鑑於這種情況,我們通常預計價格會更低。
The graphic below depicts how EPS has changed over time (unveil the exact values by clicking on the image).
下圖描述了 EPS 隨着時間的推移是如何變化的(點擊圖片可以看到確切的值)。
Dive deeper into Suzhou MedicalSystem Technology's key metrics by checking this interactive graph of Suzhou MedicalSystem Technology's earnings, revenue and cash flow.
查看這張蘇州醫療系統科技收益、收入和現金流的交互式圖表,深入了解蘇州醫療系統的關鍵指標。
A Different Perspective
不同的視角
While the broader market lost about 17% in the twelve months, Suzhou MedicalSystem Technology shareholders did even worse, losing 36%. Having said that, it's inevitable that some stocks will be oversold in a falling market. The key is to keep your eyes on the fundamental developments. Unfortunately, last year's performance may indicate unresolved challenges, given that it was worse than the annualised loss of 8% over the last half decade. Generally speaking long term share price weakness can be a bad sign, though contrarian investors might want to research the stock in hope of a turnaround. Shareholders might want to examine this detailed historical graph of past earnings, revenue and cash flow.
儘管整個市場在十二個月中下跌了約17%,但蘇州醫療系統科技股東的表現甚至更糟,下跌了36%。話雖如此,在下跌的市場中,一些股票不可避免地會被超賣。關鍵是要密切關注基本發展。不幸的是,去年的表現可能預示着尚未解決的挑戰,因爲它比過去五年中8%的年化虧損還要糟糕。總的來說,長期股價疲軟可能是一個壞兆頭,儘管逆勢投資者可能希望研究該股以期出現轉機。股東們可能需要查看這張詳細的過去收益、收入和現金流的歷史圖表。
We will like Suzhou MedicalSystem Technology better if we see some big insider buys. While we wait, check out this free list of growing companies with considerable, recent, insider buying.
如果我們看到一些重大的內幕收購,我們會更喜歡蘇州醫療系統科技。在我們等待的同時,請查看這份免費清單,列出了最近有大量內幕收購的成長型公司。
Please note, the market returns quoted in this article reflect the market weighted average returns of stocks that currently trade on Chinese exchanges.
請注意,本文引用的市場回報反映了目前在中國交易所交易的股票的市場加權平均回報。
Have feedback on this article? Concerned about the content? Get in touch with us directly. Alternatively, email editorial-team (at) simplywallst.com.
This article by Simply Wall St is general in nature. We provide commentary based on historical data and analyst forecasts only using an unbiased methodology and our articles are not intended to be financial advice. It does not constitute a recommendation to buy or sell any stock, and does not take account of your objectives, or your financial situation. We aim to bring you long-term focused analysis driven by fundamental data. Note that our analysis may not factor in the latest price-sensitive company announcements or qualitative material. Simply Wall St has no position in any stocks mentioned.
對這篇文章有反饋嗎?對內容感到擔憂?直接聯繫我們。 或者,給編輯團隊 (at) simplywallst.com 發送電子郵件。
Simply Wall St的這篇文章本質上是籠統的。我們僅使用公正的方法根據歷史數據和分析師的預測提供評論,我們的文章無意作爲財務建議。它不構成買入或賣出任何股票的建議,也沒有考慮到您的目標或財務狀況。我們的目標是爲您提供由基本數據驅動的長期重點分析。請注意,我們的分析可能不考慮最新的價格敏感型公司公告或定性材料。簡而言之,華爾街沒有持有任何上述股票的頭寸。
譯文內容由第三人軟體翻譯。