
 Yahoo Finance
 GP Industries (SGX:G20) Is Doing The Right Things To Multiply Its Share Price
To find a multi-bagger stock, what are the underlying trends we should look for in a business? Firstly, we'd want to identify a growing return on capital employed (ROCE) and then alongside that, an ever-increasing base of capital employed. Put simply, these types of businesses are compounding machines, meaning they are continually reinvesting their earnings at ever-higher rates of return. So when we looked at GP Industries (SGX:G20) and its trend of ROCE, we really liked what we saw.
What Is Return On Capital Employed (ROCE)?
If you haven't worked with ROCE before, it measures the 'return' (pre-tax profit) a company generates from capital employed in its business. To calculate this metric for GP Industries, this is the formula:
Return on Capital Employed = Earnings Before Interest and Tax (EBIT) ÷ (Total Assets - Current Liabilities)
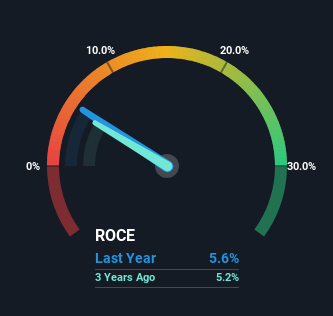
0.056 = S$34m ÷ (S$1.3b - S$717m) (Based on the trailing twelve months to September 2023).
Therefore, GP Industries has an ROCE of 5.6%. Ultimately, that's a low return and it under-performs the Electrical industry average of 8.2%.
See our latest analysis for GP Industries
While the past is not representative of the future, it can be helpful to know how a company has performed historically, which is why we have this chart above. If you want to delve into the historical earnings , check out these free graphs detailing revenue and cash flow performance of GP Industries.
The Trend Of ROCE
GP Industries is showing promise given that its ROCE is trending up and to the right. The figures show that over the last five years, ROCE has grown 69% whilst employing roughly the same amount of capital. So our take on this is that the business has increased efficiencies to generate these higher returns, all the while not needing to make any additional investments. It's worth looking deeper into this though because while it's great that the business is more efficient, it might also mean that going forward the areas to invest internally for the organic growth are lacking.
On a side note, GP Industries' current liabilities are still rather high at 54% of total assets. This can bring about some risks because the company is basically operating with a rather large reliance on its suppliers or other sorts of short-term creditors. Ideally we'd like to see this reduce as that would mean fewer obligations bearing risks.
The Key Takeaway
As discussed above, GP Industries appears to be getting more proficient at generating returns since capital employed has remained flat but earnings (before interest and tax) are up. Since the stock has only returned 8.3% to shareholders over the last five years, the promising fundamentals may not be recognized yet by investors. So exploring more about this stock could uncover a good opportunity, if the valuation and other metrics stack up.
If you'd like to know more about GP Industries, we've spotted 4 warning signs, and 2 of them make us uncomfortable.
While GP Industries may not currently earn the highest returns, we've compiled a list of companies that currently earn more than 25% return on equity. Check out this free list here.
Have feedback on this article? Concerned about the content? Get in touch with us directly. Alternatively, email editorial-team (at) simplywallst.com.
This article by Simply Wall St is general in nature. We provide commentary based on historical data and analyst forecasts only using an unbiased methodology and our articles are not intended to be financial advice. It does not constitute a recommendation to buy or sell any stock, and does not take account of your objectives, or your financial situation. We aim to bring you long-term focused analysis driven by fundamental data. Note that our analysis may not factor in the latest price-sensitive company announcements or qualitative material. Simply Wall St has no position in any stocks mentioned.
