
Is There An Opportunity With Singapore Technologies Engineering Ltd's (SGX:S63) 49% Undervaluation?
Is There An Opportunity With Singapore Technologies Engineering Ltd's (SGX:S63) 49% Undervaluation?
Key Insights
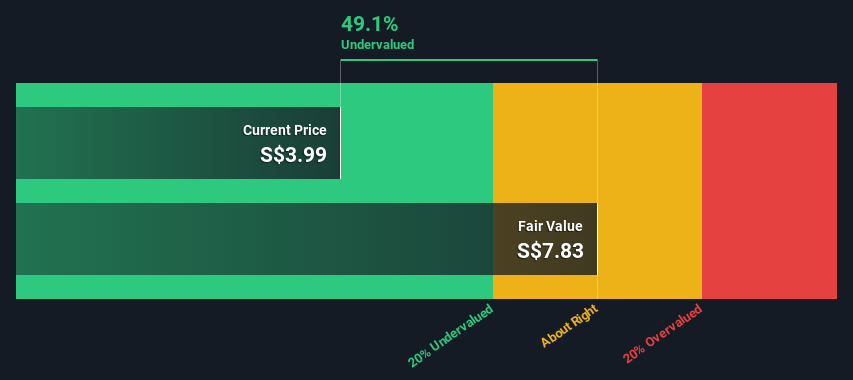
- Using the 2 Stage Free Cash Flow to Equity, Singapore Technologies Engineering fair value estimate is S$7.83
- Singapore Technologies Engineering is estimated to be 49% undervalued based on current share price of S$3.99
- The S$4.41 analyst price target for S63 is 44% less than our estimate of fair value
Does the April share price for Singapore Technologies Engineering Ltd (SGX:S63) reflect what it's really worth? Today, we will estimate the stock's intrinsic value by projecting its future cash flows and then discounting them to today's value. One way to achieve this is by employing the Discounted Cash Flow (DCF) model. There's really not all that much to it, even though it might appear quite complex.
Companies can be valued in a lot of ways, so we would point out that a DCF is not perfect for every situation. Anyone interested in learning a bit more about intrinsic value should have a read of the Simply Wall St analysis model.
Crunching The Numbers
We use what is known as a 2-stage model, which simply means we have two different periods of growth rates for the company's cash flows. Generally the first stage is higher growth, and the second stage is a lower growth phase. In the first stage we need to estimate the cash flows to the business over the next ten years. Where possible we use analyst estimates, but when these aren't available we extrapolate the previous free cash flow (FCF) from the last estimate or reported value. We assume companies with shrinking free cash flow will slow their rate of shrinkage, and that companies with growing free cash flow will see their growth rate slow, over this period. We do this to reflect that growth tends to slow more in the early years than it does in later years.
Generally we assume that a dollar today is more valuable than a dollar in the future, so we need to discount the sum of these future cash flows to arrive at a present value estimate:
10-year free cash flow (FCF) estimate
| 2024 | 2025 | 2026 | 2027 | 2028 | 2029 | 2030 | 2031 | 2032 | 2033 | |
| Levered FCF (SGD, Millions) | S$929.4m | S$992.5m | S$1.06b | S$1.15b | S$1.21b | S$1.26b | S$1.30b | S$1.34b | S$1.38b | S$1.41b |
| Growth Rate Estimate Source | Analyst x6 | Analyst x6 | Analyst x5 | Analyst x2 | Analyst x2 | Est @ 3.97% | Est @ 3.39% | Est @ 2.99% | Est @ 2.71% | Est @ 2.51% |
| Present Value (SGD, Millions) Discounted @ 6.7% | S$871 | S$871 | S$875 | S$885 | S$874 | S$852 | S$825 | S$796 | S$766 | S$736 |
("Est" = FCF growth rate estimated by Simply Wall St)
Present Value of 10-year Cash Flow (PVCF) = S$8.4b
After calculating the present value of future cash flows in the initial 10-year period, we need to calculate the Terminal Value, which accounts for all future cash flows beyond the first stage. The Gordon Growth formula is used to calculate Terminal Value at a future annual growth rate equal to the 5-year average of the 10-year government bond yield of 2.1%. We discount the terminal cash flows to today's value at a cost of equity of 6.7%.
Terminal Value (TV)= FCF2033 × (1 + g) ÷ (r – g) = S$1.4b× (1 + 2.1%) ÷ (6.7%– 2.1%) = S$31b
Present Value of Terminal Value (PVTV)= TV / (1 + r)10= S$31b÷ ( 1 + 6.7%)10= S$16b
The total value, or equity value, is then the sum of the present value of the future cash flows, which in this case is S$24b. To get the intrinsic value per share, we divide this by the total number of shares outstanding. Compared to the current share price of S$4.0, the company appears quite good value at a 49% discount to where the stock price trades currently. The assumptions in any calculation have a big impact on the valuation, so it is better to view this as a rough estimate, not precise down to the last cent.
Important Assumptions
The calculation above is very dependent on two assumptions. The first is the discount rate and the other is the cash flows. If you don't agree with these result, have a go at the calculation yourself and play with the assumptions. The DCF also does not consider the possible cyclicality of an industry, or a company's future capital requirements, so it does not give a full picture of a company's potential performance. Given that we are looking at Singapore Technologies Engineering as potential shareholders, the cost of equity is used as the discount rate, rather than the cost of capital (or weighted average cost of capital, WACC) which accounts for debt. In this calculation we've used 6.7%, which is based on a levered beta of 1.015. Beta is a measure of a stock's volatility, compared to the market as a whole. We get our beta from the industry average beta of globally comparable companies, with an imposed limit between 0.8 and 2.0, which is a reasonable range for a stable business.
SWOT Analysis for Singapore Technologies Engineering
- Earnings growth over the past year exceeded its 5-year average.
- Debt is well covered by earnings and cashflows.
- Dividends are covered by earnings and cash flows.
- Dividend information for S63.
- Earnings growth over the past year underperformed the Aerospace & Defense industry.
- Dividend is low compared to the top 25% of dividend payers in the Aerospace & Defense market.
- Annual earnings are forecast to grow faster than the Singaporean market.
- Trading below our estimate of fair value by more than 20%.
- Revenue is forecast to grow slower than 20% per year.
- What else are analysts forecasting for S63?
Next Steps:
Whilst important, the DCF calculation is only one of many factors that you need to assess for a company. The DCF model is not a perfect stock valuation tool. Rather it should be seen as a guide to "what assumptions need to be true for this stock to be under/overvalued?" If a company grows at a different rate, or if its cost of equity or risk free rate changes sharply, the output can look very different. Can we work out why the company is trading at a discount to intrinsic value? For Singapore Technologies Engineering, we've compiled three fundamental elements you should consider:
- Risks: Take risks, for example - Singapore Technologies Engineering has 2 warning signs we think you should be aware of.
- Future Earnings: How does S63's growth rate compare to its peers and the wider market? Dig deeper into the analyst consensus number for the upcoming years by interacting with our free analyst growth expectation chart.
- Other High Quality Alternatives: Do you like a good all-rounder? Explore our interactive list of high quality stocks to get an idea of what else is out there you may be missing!
PS. The Simply Wall St app conducts a discounted cash flow valuation for every stock on the SGX every day. If you want to find the calculation for other stocks just search here.
Have feedback on this article? Concerned about the content? Get in touch with us directly. Alternatively, email editorial-team (at) simplywallst.com.
This article by Simply Wall St is general in nature. We provide commentary based on historical data and analyst forecasts only using an unbiased methodology and our articles are not intended to be financial advice. It does not constitute a recommendation to buy or sell any stock, and does not take account of your objectives, or your financial situation. We aim to bring you long-term focused analysis driven by fundamental data. Note that our analysis may not factor in the latest price-sensitive company announcements or qualitative material. Simply Wall St has no position in any stocks mentioned.
關鍵見解
- 使用兩階段自由現金流股權,新加坡科技工程的公允價值估計爲7.83新元
- 根據目前3.99新元的股價,新加坡科技工程的估值估計被低估了49%
- 分析師對S63的目標股價爲4.41新元,比我們對公允價值的估計低44%
新加坡科技工程有限公司(SGX: S63)4月份的股價是否反映了其真正價值?今天,我們將通過預測股票的未來現金流來估算股票的內在價值,然後將其折現爲今天的價值。實現這一目標的一種方法是使用折扣現金流(DCF)模型。儘管它可能看起來很複雜,但實際上並沒有那麼多。
公司可以在很多方面得到估值,因此我們要指出,DCF並不適合所有情況。任何有興趣進一步了解內在價值的人都應該讀一讀 Simply Wall St 分析模型。
計算數字
我們使用所謂的兩階段模型,這僅意味着公司的現金流有兩個不同的增長期。通常,第一階段是較高的增長階段,第二階段是較低的增長階段。在第一階段,我們需要估算未來十年的業務現金流。在可能的情況下,我們會使用分析師的估計值,但是當這些估計值不可用時,我們會從最新的估計值或報告的價值中推斷出之前的自由現金流(FCF)。我們假設自由現金流萎縮的公司將減緩其萎縮速度,而自由現金流不斷增長的公司在此期間的增長率將放緩。我們這樣做是爲了反映早期增長的放緩幅度往往比後來的幾年更大。
通常,我們假設今天的一美元比未來一美元更有價值,因此我們需要對這些未來現金流的總和進行折價才能得出現值估計:
10 年自由現金流 (FCF) 估計
| 2024 | 2025 | 2026 | 2027 | 2028 | 2029 | 2030 | 2031 | 2032 | 2033 | |
| Levered FCF(新加坡元,百萬) | 9.294 億新元 | 992.5 億新元 | 10.6 億新元 | 11.5億新元 | 12.1億新元 | 12.6億新元 | 1.30億新元 | 134億新元 | 138億新元 | 141億新元 |
| 增長率估算來源 | 分析師 x6 | 分析師 x6 | 分析師 x5 | 分析師 x2 | 分析師 x2 | Est @ 3.97% | Est @ 3.39% | Est @ 2.99% | Est @ 2.71% | Est @ 2.51% |
| 現值(新加坡元,百萬元)折扣 @ 6.7% | 871 新元 | 871 新元 | 875 新元 | 885 新幣 | 874 新幣 | 852 新幣 | 825 新元 | 796 新元 | 766 新元 | 736 新元 |
(“Est” = Simply Wall St估計的FCF增長率)
10 年期現金流 (PVCF) 的現值 = 84億新元
在計算了最初10年期內未來現金流的現值之後,我們需要計算終值,該終值涵蓋了第一階段以後的所有未來現金流。戈登增長公式用於計算終值,其未來年增長率等於10年期國債收益率2.1%的5年平均水平。我們將終端現金流折現爲今天的價值,股本成本爲6.7%。
終端價值 (TV) = FCF2033 × (1 + g) ÷ (r — g) = 14億新元× (1 + 2.1%) ÷ (6.7% — 2.1%) = 310億新元
終端價值的現值 (PVTV) = 電視/ (1 + r)10= 310億新元÷ (1 + 6.7%)10= 160 億新元
因此,總價值或權益價值是未來現金流現值的總和,在本例中爲240億新元。爲了得出每股內在價值,我們將其除以已發行股票總數。與目前4.0新元的股價相比,該公司看起來物有所值,與目前的股價相比折扣了49%。任何計算中的假設都會對估值產生重大影響,因此最好將其視爲粗略的估計,而不是精確到最後一美分。
重要假設
上面的計算在很大程度上取決於兩個假設。第一個是貼現率,另一個是現金流。如果你不同意這些結果,那就自己計算一下,試一試假設。DCF也沒有考慮一個行業可能的週期性,也沒有考慮公司未來的資本需求,因此它沒有全面反映公司的潛在表現。鑑於我們將新加坡科技工程視爲潛在股東,因此使用股本成本作爲貼現率,而不是構成債務的資本成本(或加權平均資本成本,WACC)。在此計算中,我們使用了6.7%,這是基於1.015的槓桿測試版。Beta是衡量股票與整個市場相比波動性的指標。我們的測試版來自全球可比公司的行業平均貝塔值,設定在0.8到2.0之間,這是一個穩定的業務的合理範圍。
新加坡技術工程的 SWOT 分析
- 過去一年的收益增長超過了其5年平均水平。
- 收益和現金流足以彌補債務。
- 股息由收益和現金流支付。
- S63 的股息信息。
- 過去一年的收益增長低於航空航天和國防行業。
- 與航空航天和國防市場前25%的股息支付者相比,股息很低。
- 預計年收入的增長速度將快於新加坡市場。
- 交易價格比我們估計的公允價值低20%以上。
- 預計收入每年增長將低於20%。
- 分析師對S63還有什麼預測?
後續步驟:
雖然重要,但DCF的計算只是公司需要評估的衆多因素之一。DCF模型不是完美的股票估值工具。相反,它應該被視爲 “需要哪些假設才能低估/高估這隻股票的價值?” 的指南如果一家公司以不同的速度增長,或者其股本成本或無風險利率急劇變化,則產出可能會大不相同。我們能否弄清楚爲什麼公司的交易價格低於內在價值?對於新加坡技術工程,我們整理了您應該考慮的三個基本要素:
- 風險:例如,冒險——新加坡科技工程公司有兩個警告信號,我們認爲你應該注意。
- 未來收益:與同行和整個市場相比,S63的增長率如何?通過與我們的免費分析師增長預期圖表互動,深入了解未來幾年的分析師共識數字。
- 其他高質量的替代品:你喜歡一個優秀的全能選手嗎?瀏覽我們的高品質股票互動清單,了解您可能還會錯過什麼!
PS。Simply Wall St應用程序每天對新加坡交易所的每隻股票進行折扣現金流估值。如果您想找到其他股票的計算方法,請在此處搜索。
對這篇文章有反饋嗎?對內容感到擔憂?直接聯繫我們。 或者,給編輯團隊 (at) simplywallst.com 發送電子郵件。
Simply Wall St的這篇文章本質上是籠統的。我們僅使用公正的方法根據歷史數據和分析師的預測提供評論,我們的文章無意作爲財務建議。它不構成買入或賣出任何股票的建議,也沒有考慮到您的目標或財務狀況。我們的目標是爲您提供由基本數據驅動的長期重點分析。請注意,我們的分析可能不考慮最新的價格敏感型公司公告或定性材料。簡而言之,華爾街沒有持有任何上述股票的頭寸。
譯文內容由第三人軟體翻譯。
風險及免責聲明
- 分享到weixin
- 分享到qq
- 分享到facebook
- 分享到twitter
- 分享到微博
- 粘贴板
使用瀏覽器的分享功能,分享給你的好友吧