
Tetra Tech (NASDAQ:TTEK) Jumps 3.6% This Week, Though Earnings Growth Is Still Tracking Behind Five-year Shareholder Returns
Tetra Tech (NASDAQ:TTEK) Jumps 3.6% This Week, Though Earnings Growth Is Still Tracking Behind Five-year Shareholder Returns
The worst result, after buying shares in a company (assuming no leverage), would be if you lose all the money you put in. But on the bright side, you can make far more than 100% on a really good stock. For example, the Tetra Tech, Inc. (NASDAQ:TTEK) share price has soared 216% in the last half decade. Most would be very happy with that. Also pleasing for shareholders was the 16% gain in the last three months. But this could be related to the strong market, which is up 10% in the last three months.
在購買公司股票(假設沒有槓桿作用)之後,最糟糕的結果是你損失了所有投入的資金。但好的一面是,購買一隻非常好的股票,您可以賺取超過100%的收入。例如,利樂科技公司(納斯達克股票代碼:TTEK)的股價在過去五年中飆升了216%。大多數人會對此感到非常滿意。同樣令股東高興的是過去三個月的16%的漲幅。但這可能與強勁的市場有關,市場在過去三個月中上漲了10%。
After a strong gain in the past week, it's worth seeing if longer term returns have been driven by improving fundamentals.
在過去一週強勁上漲之後,值得一看的是長期回報是否是由基本面改善推動的。
While markets are a powerful pricing mechanism, share prices reflect investor sentiment, not just underlying business performance. One imperfect but simple way to consider how the market perception of a company has shifted is to compare the change in the earnings per share (EPS) with the share price movement.
雖然市場是一種強大的定價機制,但股價反映了投資者的情緒,而不僅僅是潛在的業務表現。考慮市場對公司的看法發生了怎樣的變化的一種不完美但簡單的方法是將每股收益(EPS)的變化與股價走勢進行比較。
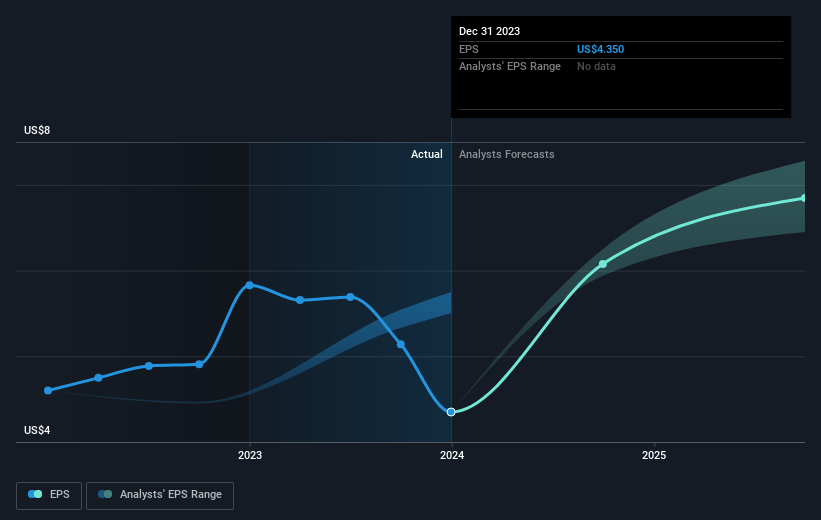
During five years of share price growth, Tetra Tech achieved compound earnings per share (EPS) growth of 13% per year. This EPS growth is lower than the 26% average annual increase in the share price. This suggests that market participants hold the company in higher regard, these days. That's not necessarily surprising considering the five-year track record of earnings growth.
在五年的股價增長中,利樂科技實現了每年13%的複合每股收益(EPS)增長。每股收益的增長低於股價年均增長26%。這表明,如今,市場參與者對公司的重視程度更高。考慮到五年的收益增長記錄,這並不一定令人驚訝。
You can see how EPS has changed over time in the image below (click on the chart to see the exact values).
您可以在下圖中看到 EPS 隨時間推移的變化(點擊圖表查看確切值)。
Dive deeper into Tetra Tech's key metrics by checking this interactive graph of Tetra Tech's earnings, revenue and cash flow.
查看這張利樂科技收益、收入和現金流的交互式圖表,深入了解利樂科技的關鍵指標。
What About Dividends?
分紅呢?
When looking at investment returns, it is important to consider the difference between total shareholder return (TSR) and share price return. Whereas the share price return only reflects the change in the share price, the TSR includes the value of dividends (assuming they were reinvested) and the benefit of any discounted capital raising or spin-off. It's fair to say that the TSR gives a more complete picture for stocks that pay a dividend. In the case of Tetra Tech, it has a TSR of 227% for the last 5 years. That exceeds its share price return that we previously mentioned. This is largely a result of its dividend payments!
在考慮投資回報時,重要的是要考慮兩者之間的區別 股東總回報 (TSR) 和 股價回報。儘管股價回報率僅反映股價的變化,但股東總回報率包括股息的價值(假設已進行再投資)以及任何折扣融資或分拆的收益。可以公平地說,股東總回報率爲支付股息的股票提供了更完整的畫面。就利樂科技而言,在過去的5年中,其股東回報率爲227%。這超過了我們之前提到的其股價回報率。這在很大程度上是其股息支付的結果!
A Different Perspective
不同的視角
It's good to see that Tetra Tech has rewarded shareholders with a total shareholder return of 33% in the last twelve months. And that does include the dividend. That's better than the annualised return of 27% over half a decade, implying that the company is doing better recently. Someone with an optimistic perspective could view the recent improvement in TSR as indicating that the business itself is getting better with time. It's always interesting to track share price performance over the longer term. But to understand Tetra Tech better, we need to consider many other factors. Consider for instance, the ever-present spectre of investment risk. We've identified 3 warning signs with Tetra Tech , and understanding them should be part of your investment process.
很高興看到利樂科技在過去十二個月中向股東提供了33%的總股東回報率。這確實包括股息。這比五年來27%的年化回報率要好,這意味着該公司最近的表現更好。持樂觀態度的人可能會將最近股東總回報率的改善視爲業務本身隨着時間的推移而變得更好。長期跟蹤股價表現總是很有意思的。但是,爲了更好地了解利樂科技,我們需要考慮許多其他因素。例如,投資風險的幽靈無處不在。我們已經確定了Tetra Tech的3個警告信號,了解它們應該是您投資過程的一部分。
Of course, you might find a fantastic investment by looking elsewhere. So take a peek at this free list of companies we expect will grow earnings.
當然,通過尋找其他地方,你可能會找到一筆不錯的投資。因此,請看一下我們預計收益將增加的這份免費公司名單。
Please note, the market returns quoted in this article reflect the market weighted average returns of stocks that currently trade on American exchanges.
請注意,本文引用的市場回報反映了目前在美國交易所交易的股票的市場加權平均回報。
Have feedback on this article? Concerned about the content? Get in touch with us directly. Alternatively, email editorial-team (at) simplywallst.com.
This article by Simply Wall St is general in nature. We provide commentary based on historical data and analyst forecasts only using an unbiased methodology and our articles are not intended to be financial advice. It does not constitute a recommendation to buy or sell any stock, and does not take account of your objectives, or your financial situation. We aim to bring you long-term focused analysis driven by fundamental data. Note that our analysis may not factor in the latest price-sensitive company announcements or qualitative material. Simply Wall St has no position in any stocks mentioned.
對這篇文章有反饋嗎?對內容感到擔憂?直接聯繫我們。 或者,給編輯團隊 (at) simplywallst.com 發送電子郵件。
Simply Wall St的這篇文章本質上是籠統的。我們僅使用公正的方法根據歷史數據和分析師的預測提供評論,我們的文章無意作爲財務建議。它不構成買入或賣出任何股票的建議,也沒有考慮到您的目標或財務狀況。我們的目標是爲您提供由基本數據驅動的長期重點分析。請注意,我們的分析可能不考慮最新的價格敏感型公司公告或定性材料。簡而言之,華爾街沒有持有任何上述股票的頭寸。
譯文內容由第三人軟體翻譯。